POST-PROC 2 – Simulation Data Analysis

POST-PROC 2 program interface
Scientific
evaluation & visualization

Fields of application of POST-PROC 2

Simulation results

Simulation results

Analysis of time-dependent and dynamic data

Flexible diagrams

Flexible diagrams

Strict separation of data and layout

Graphic export

Graphic export

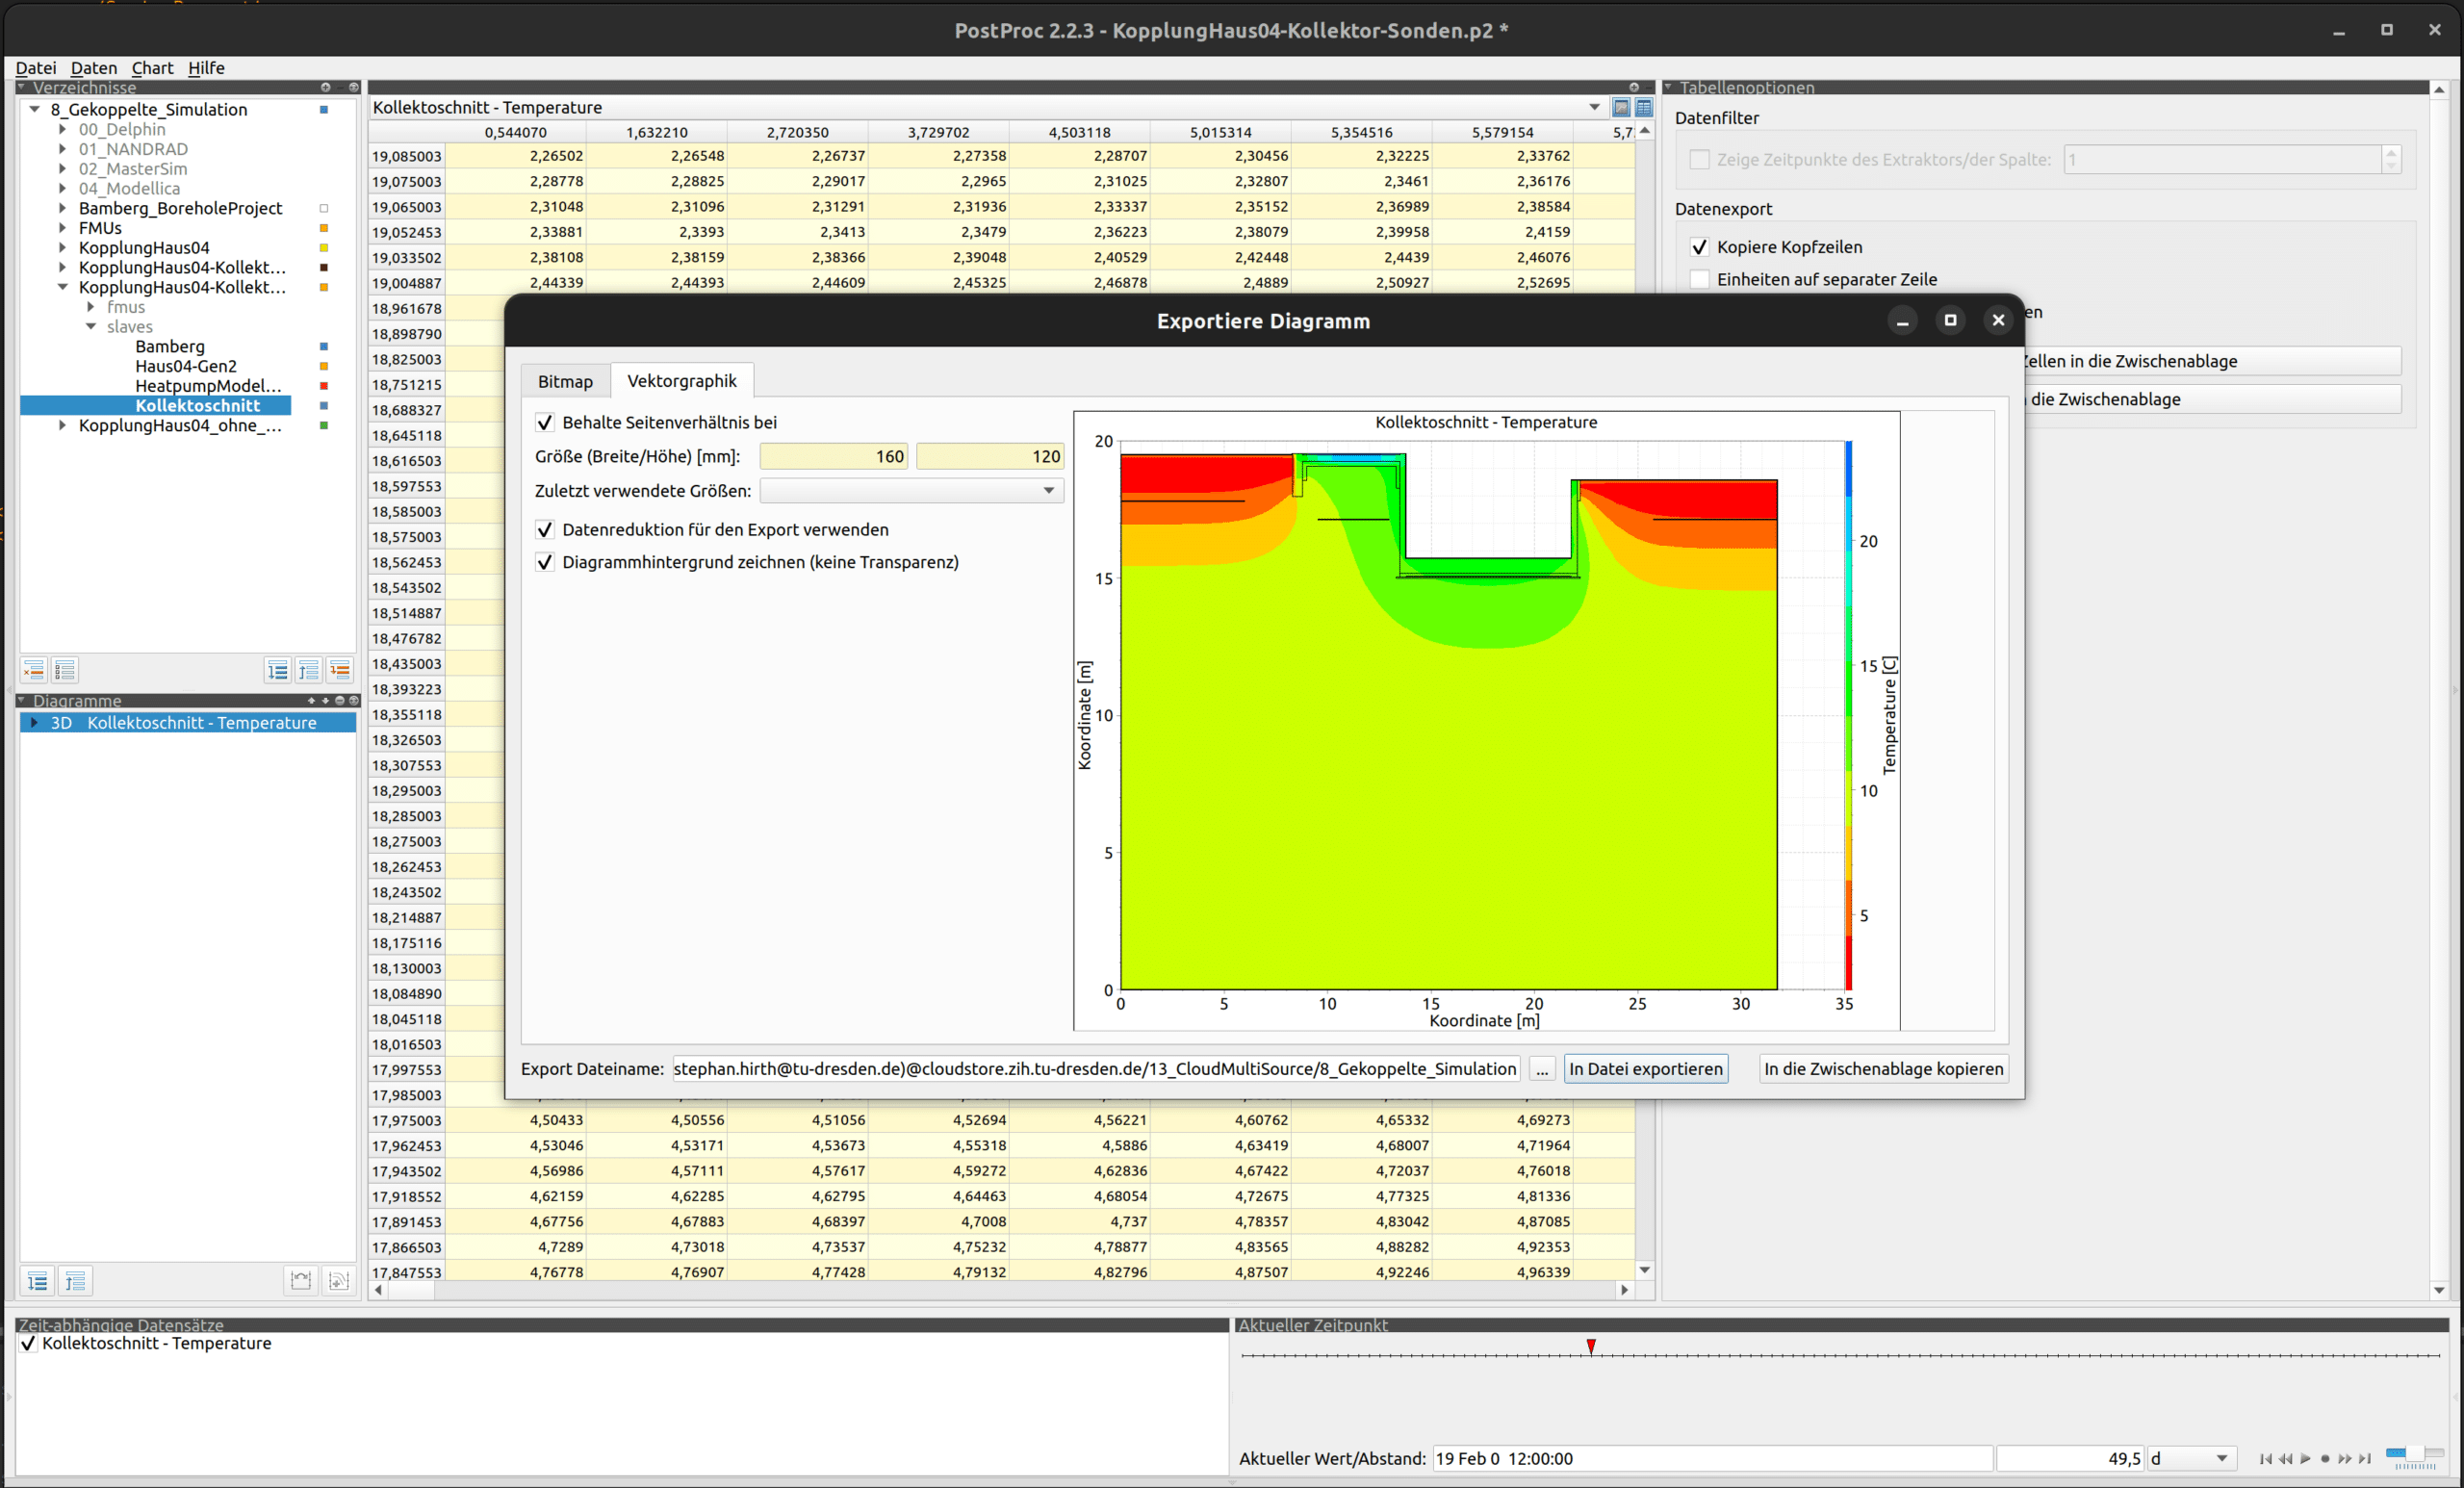
Export of raster and vector graphics

Calculation models

Calculation models

Integrated models for further evaluation

Screenshots of POST-PROC 2

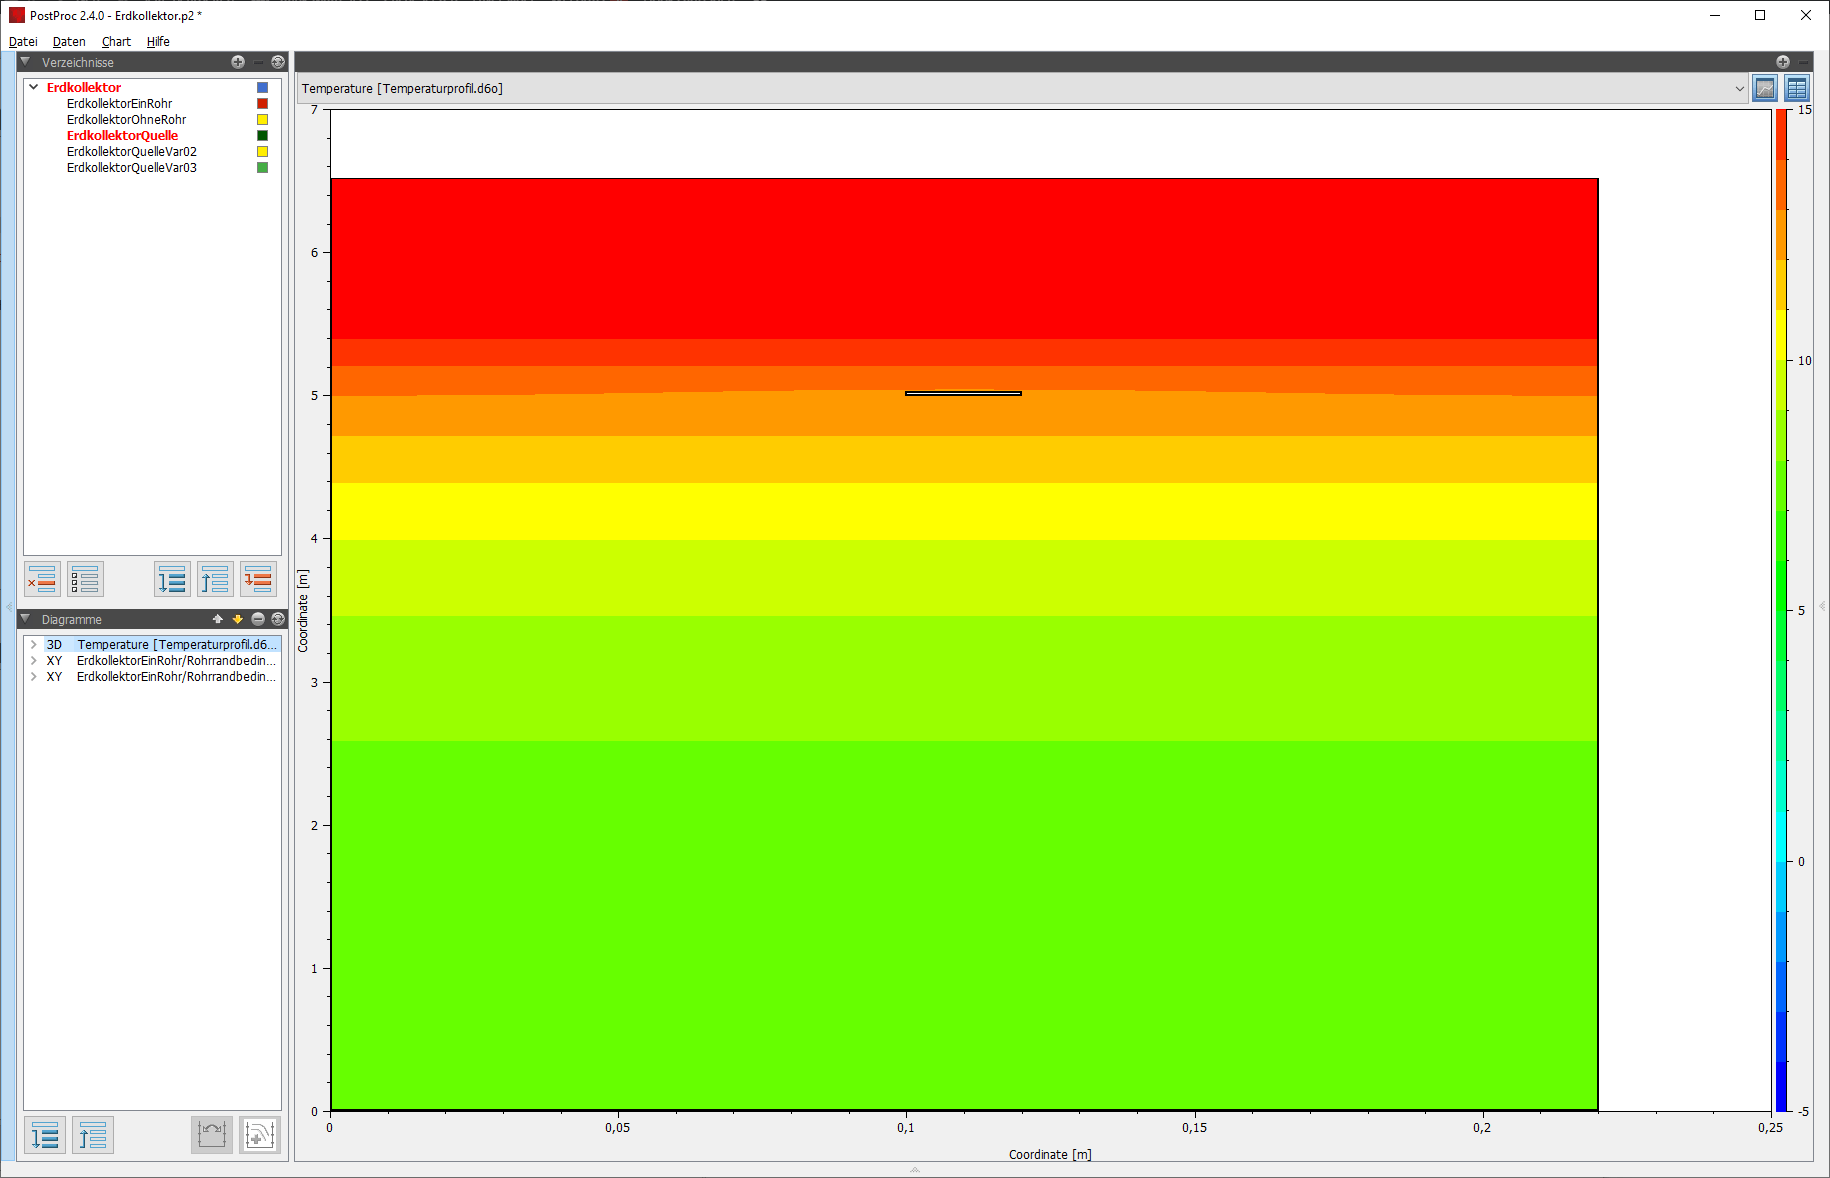
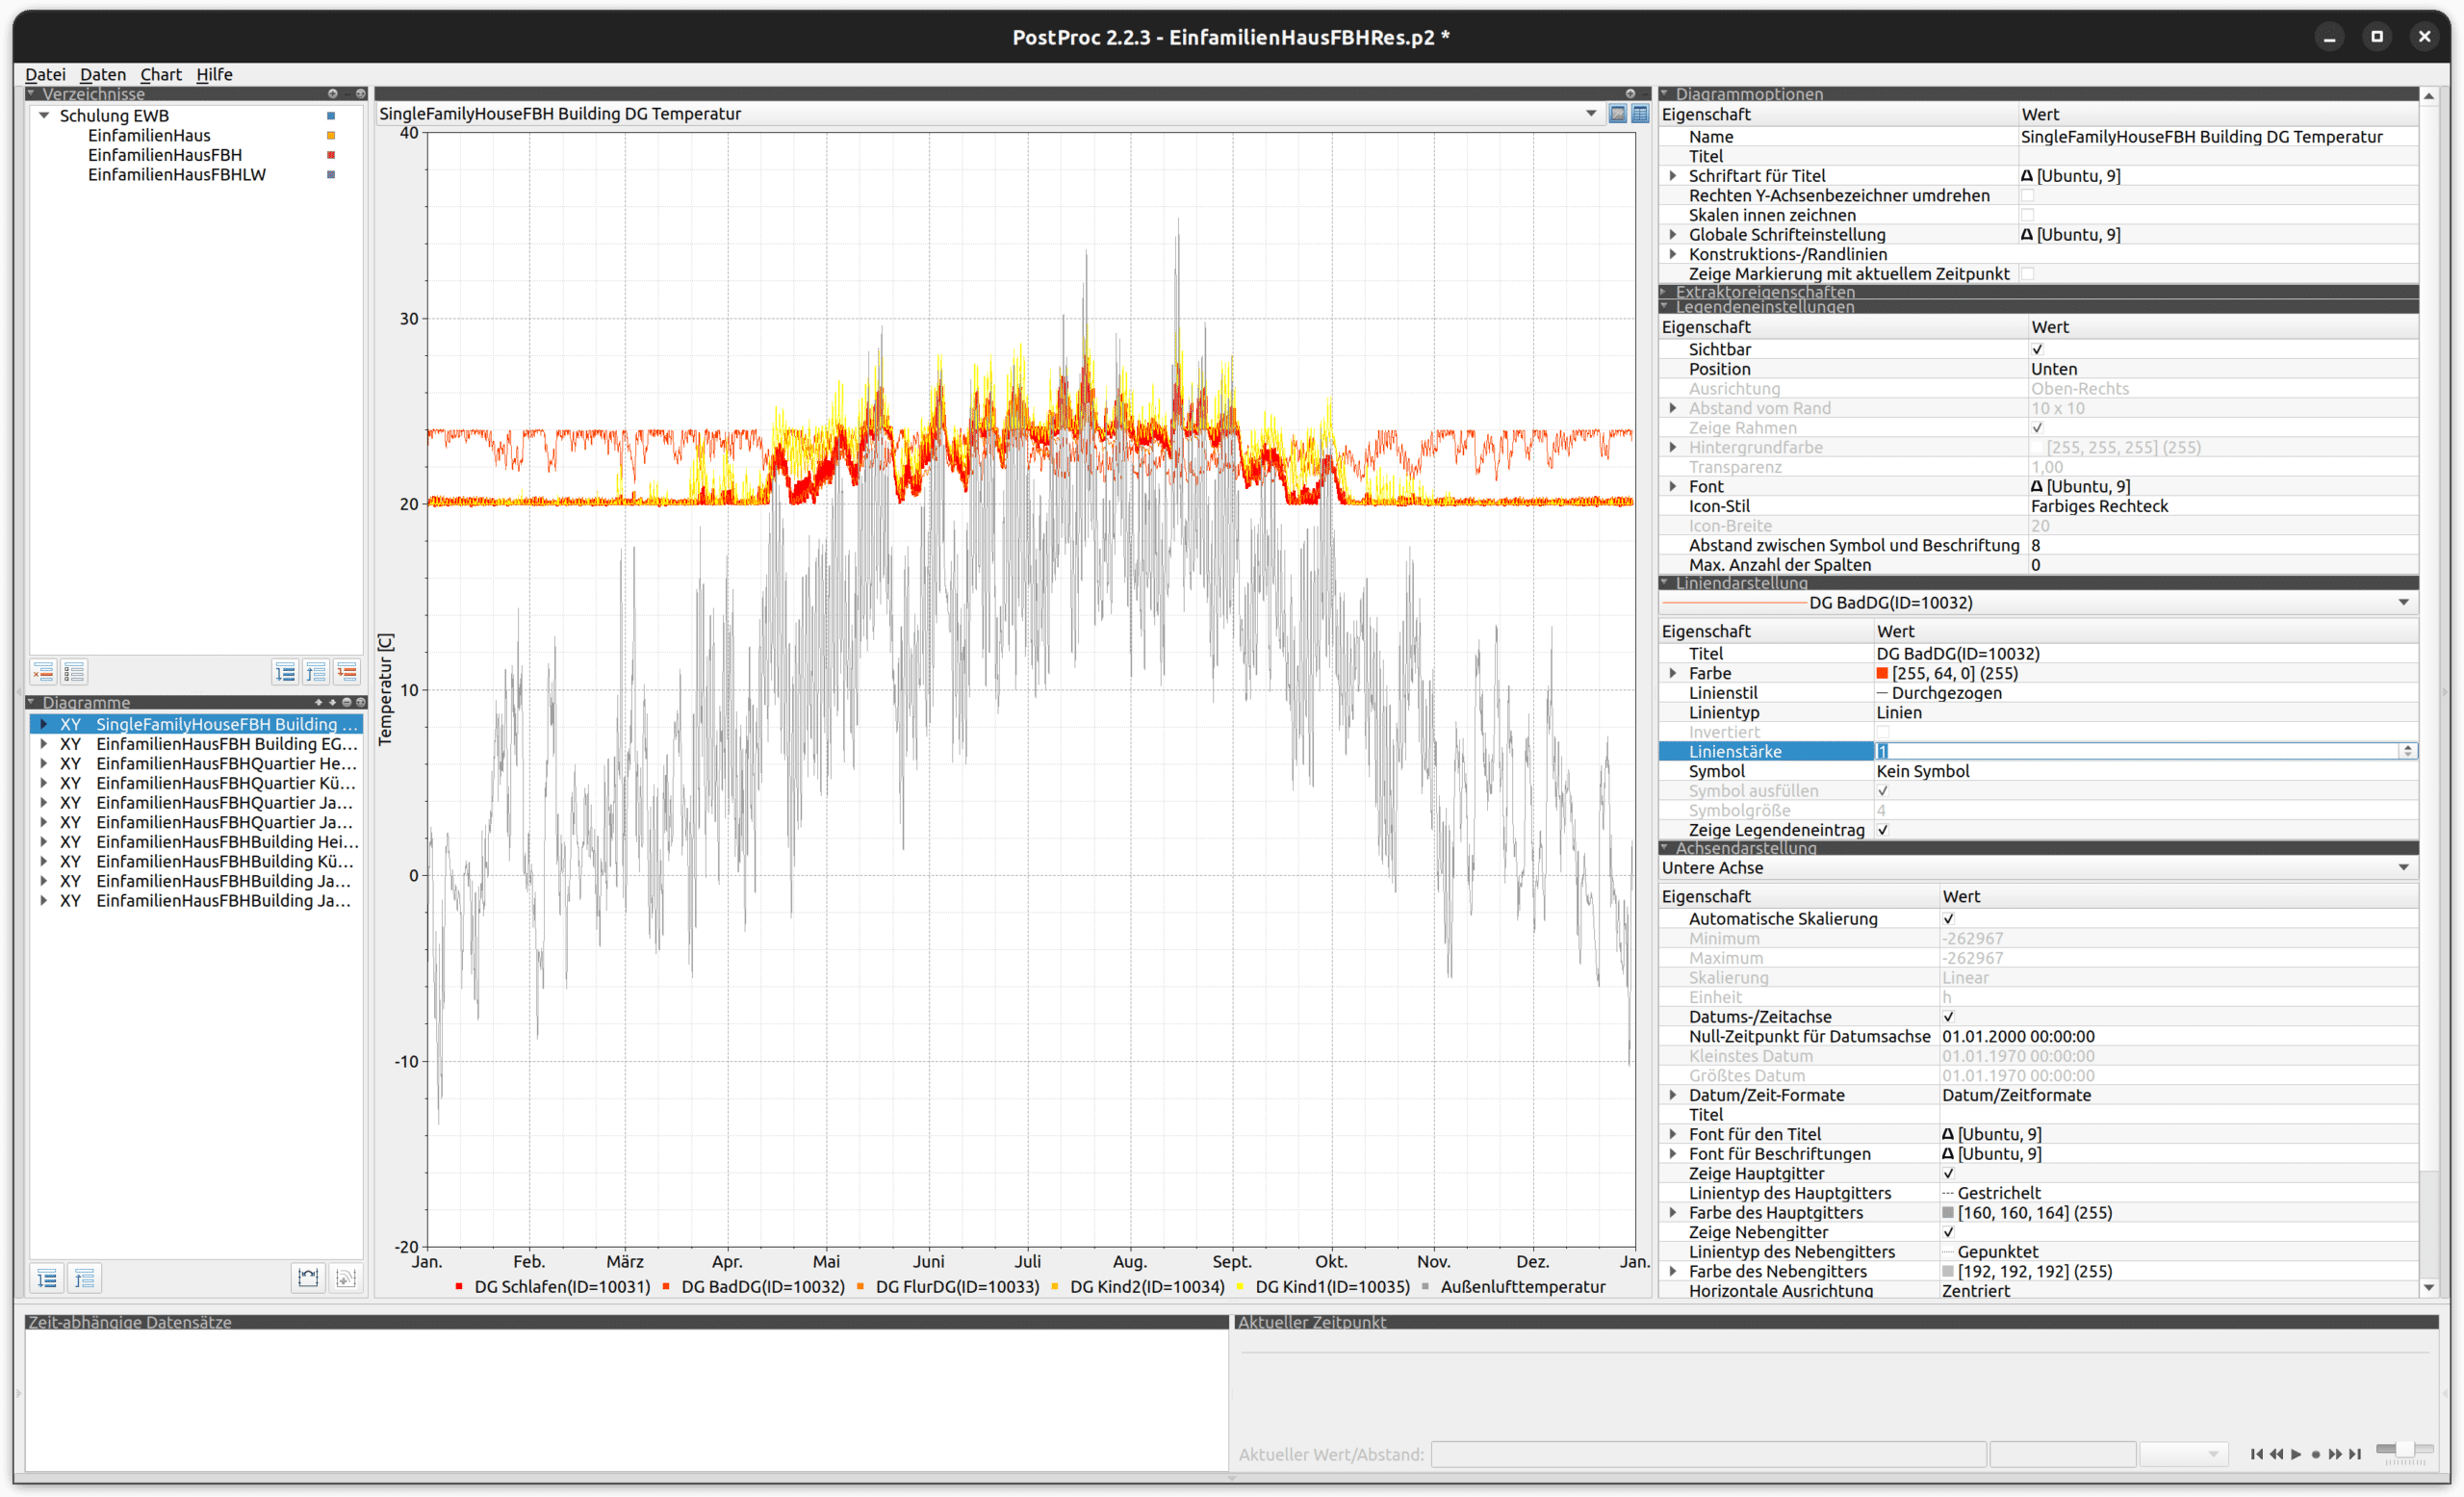
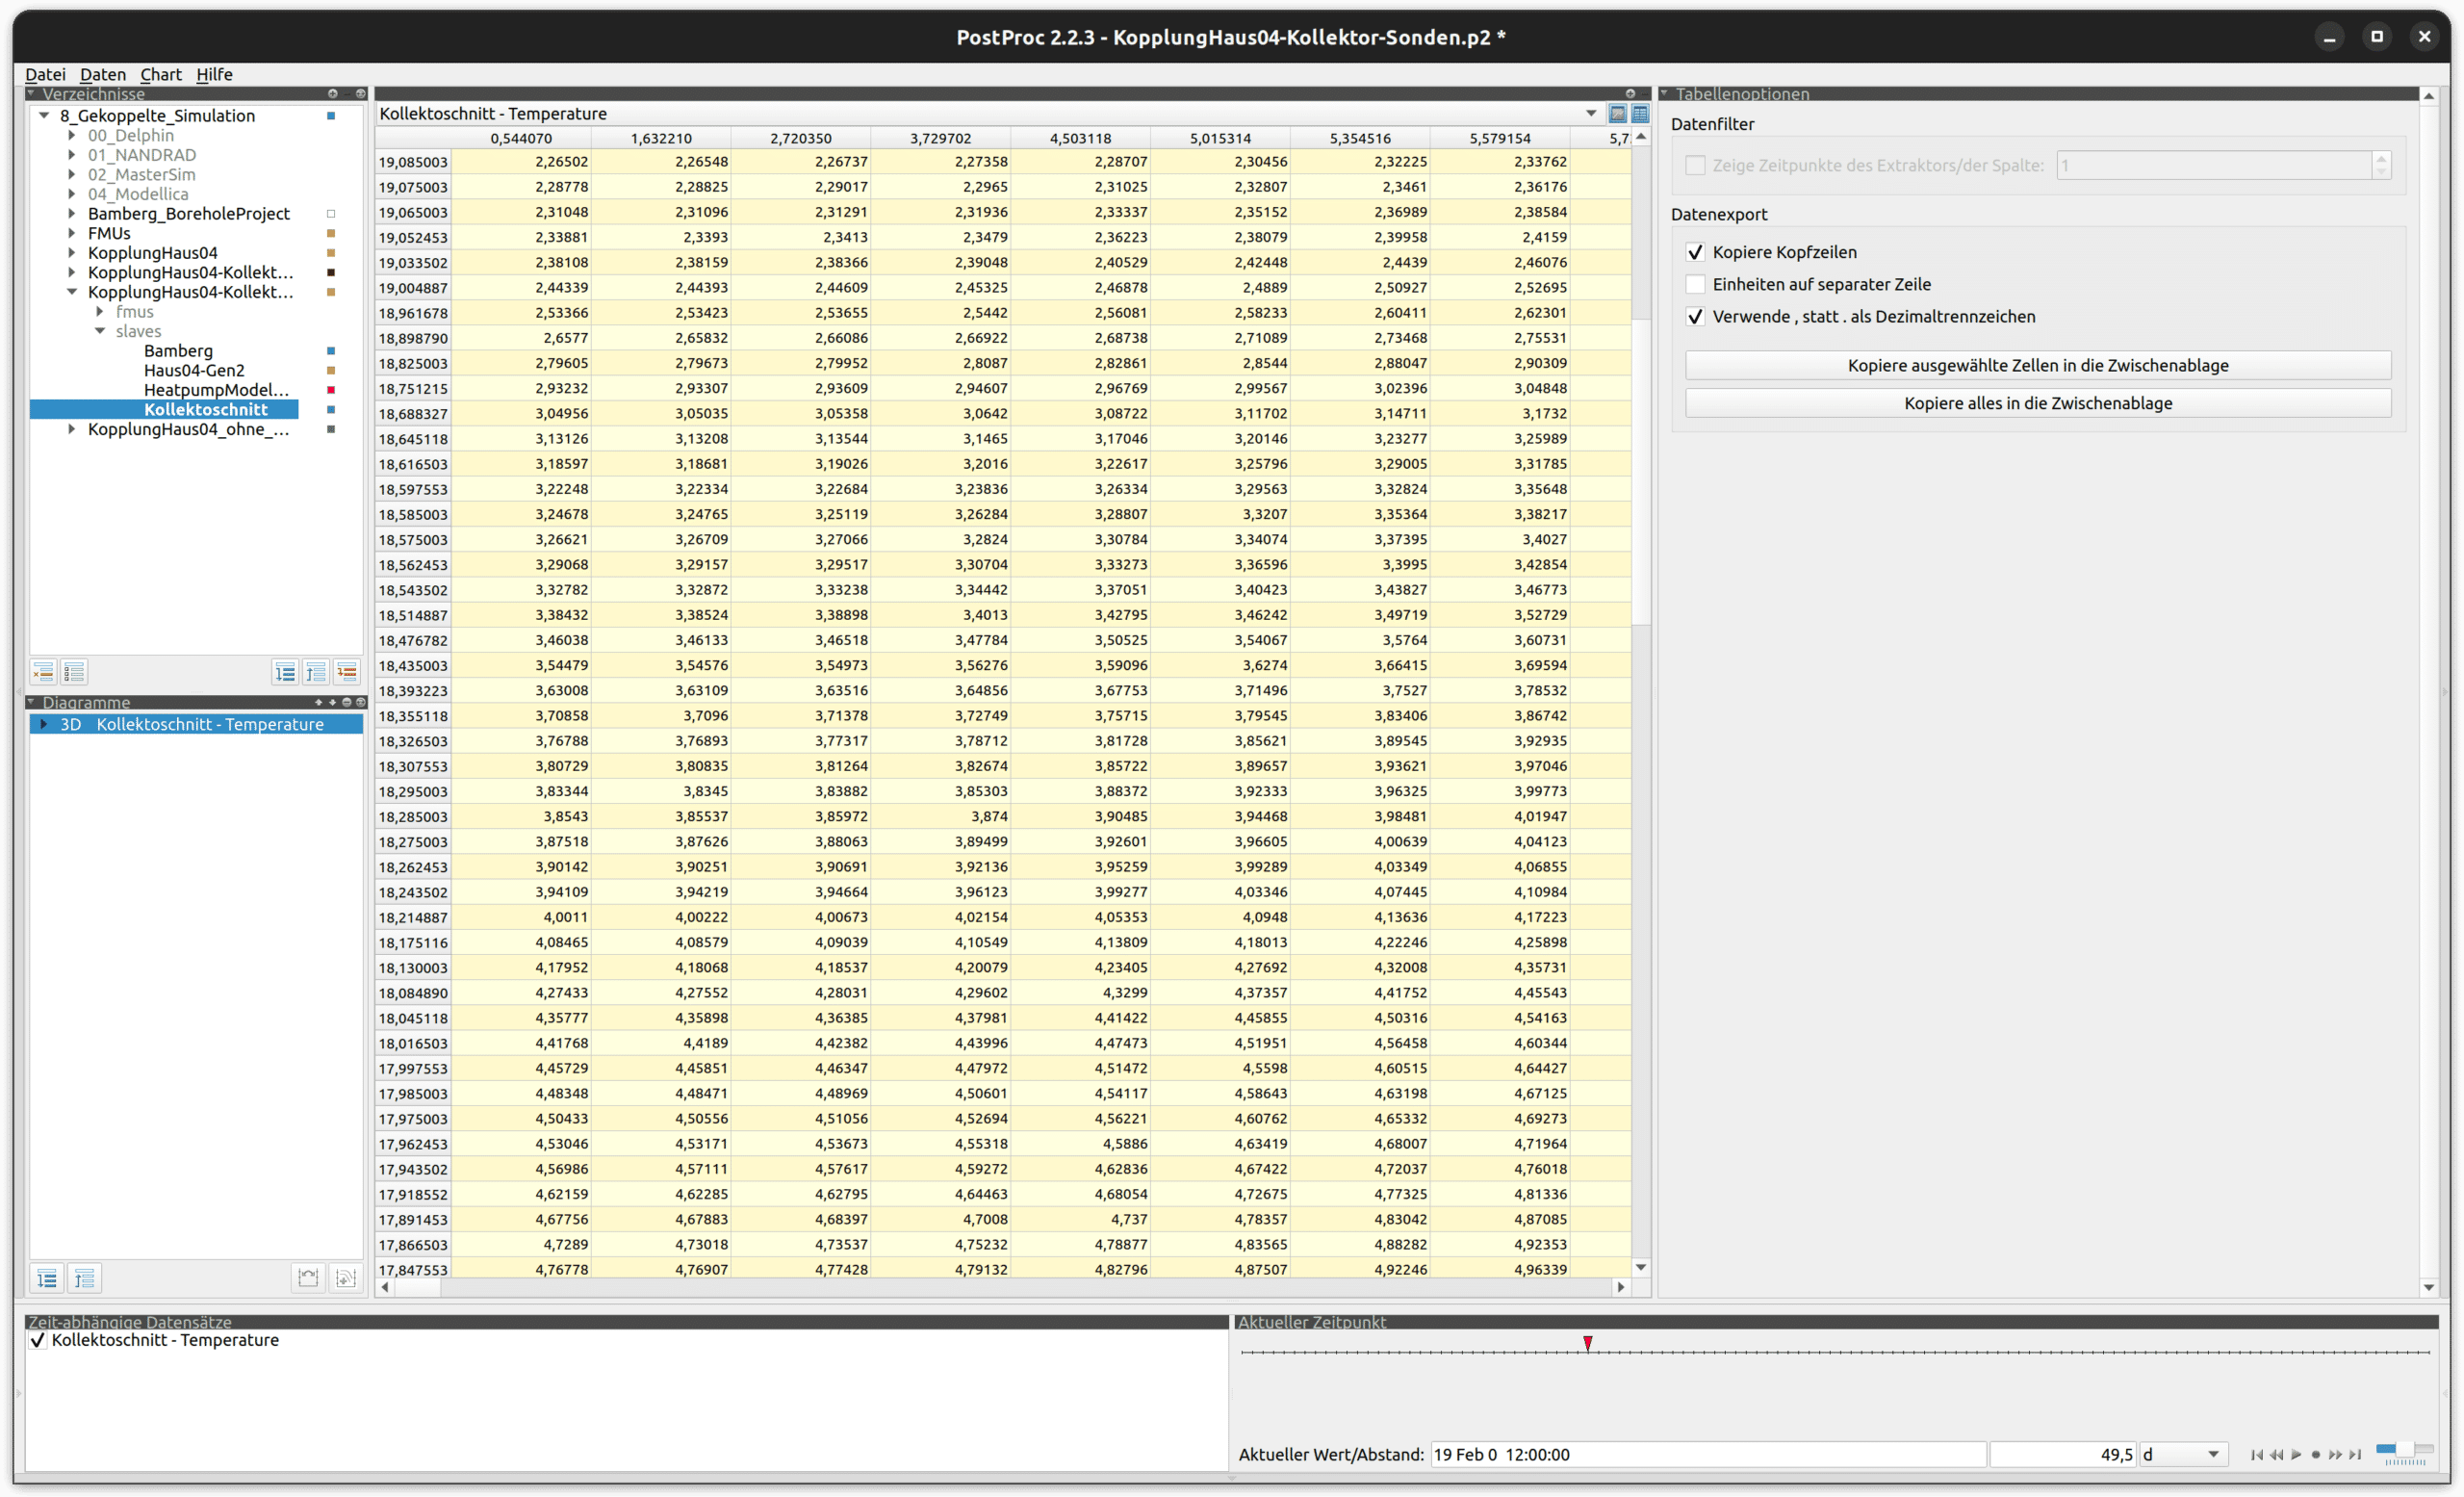
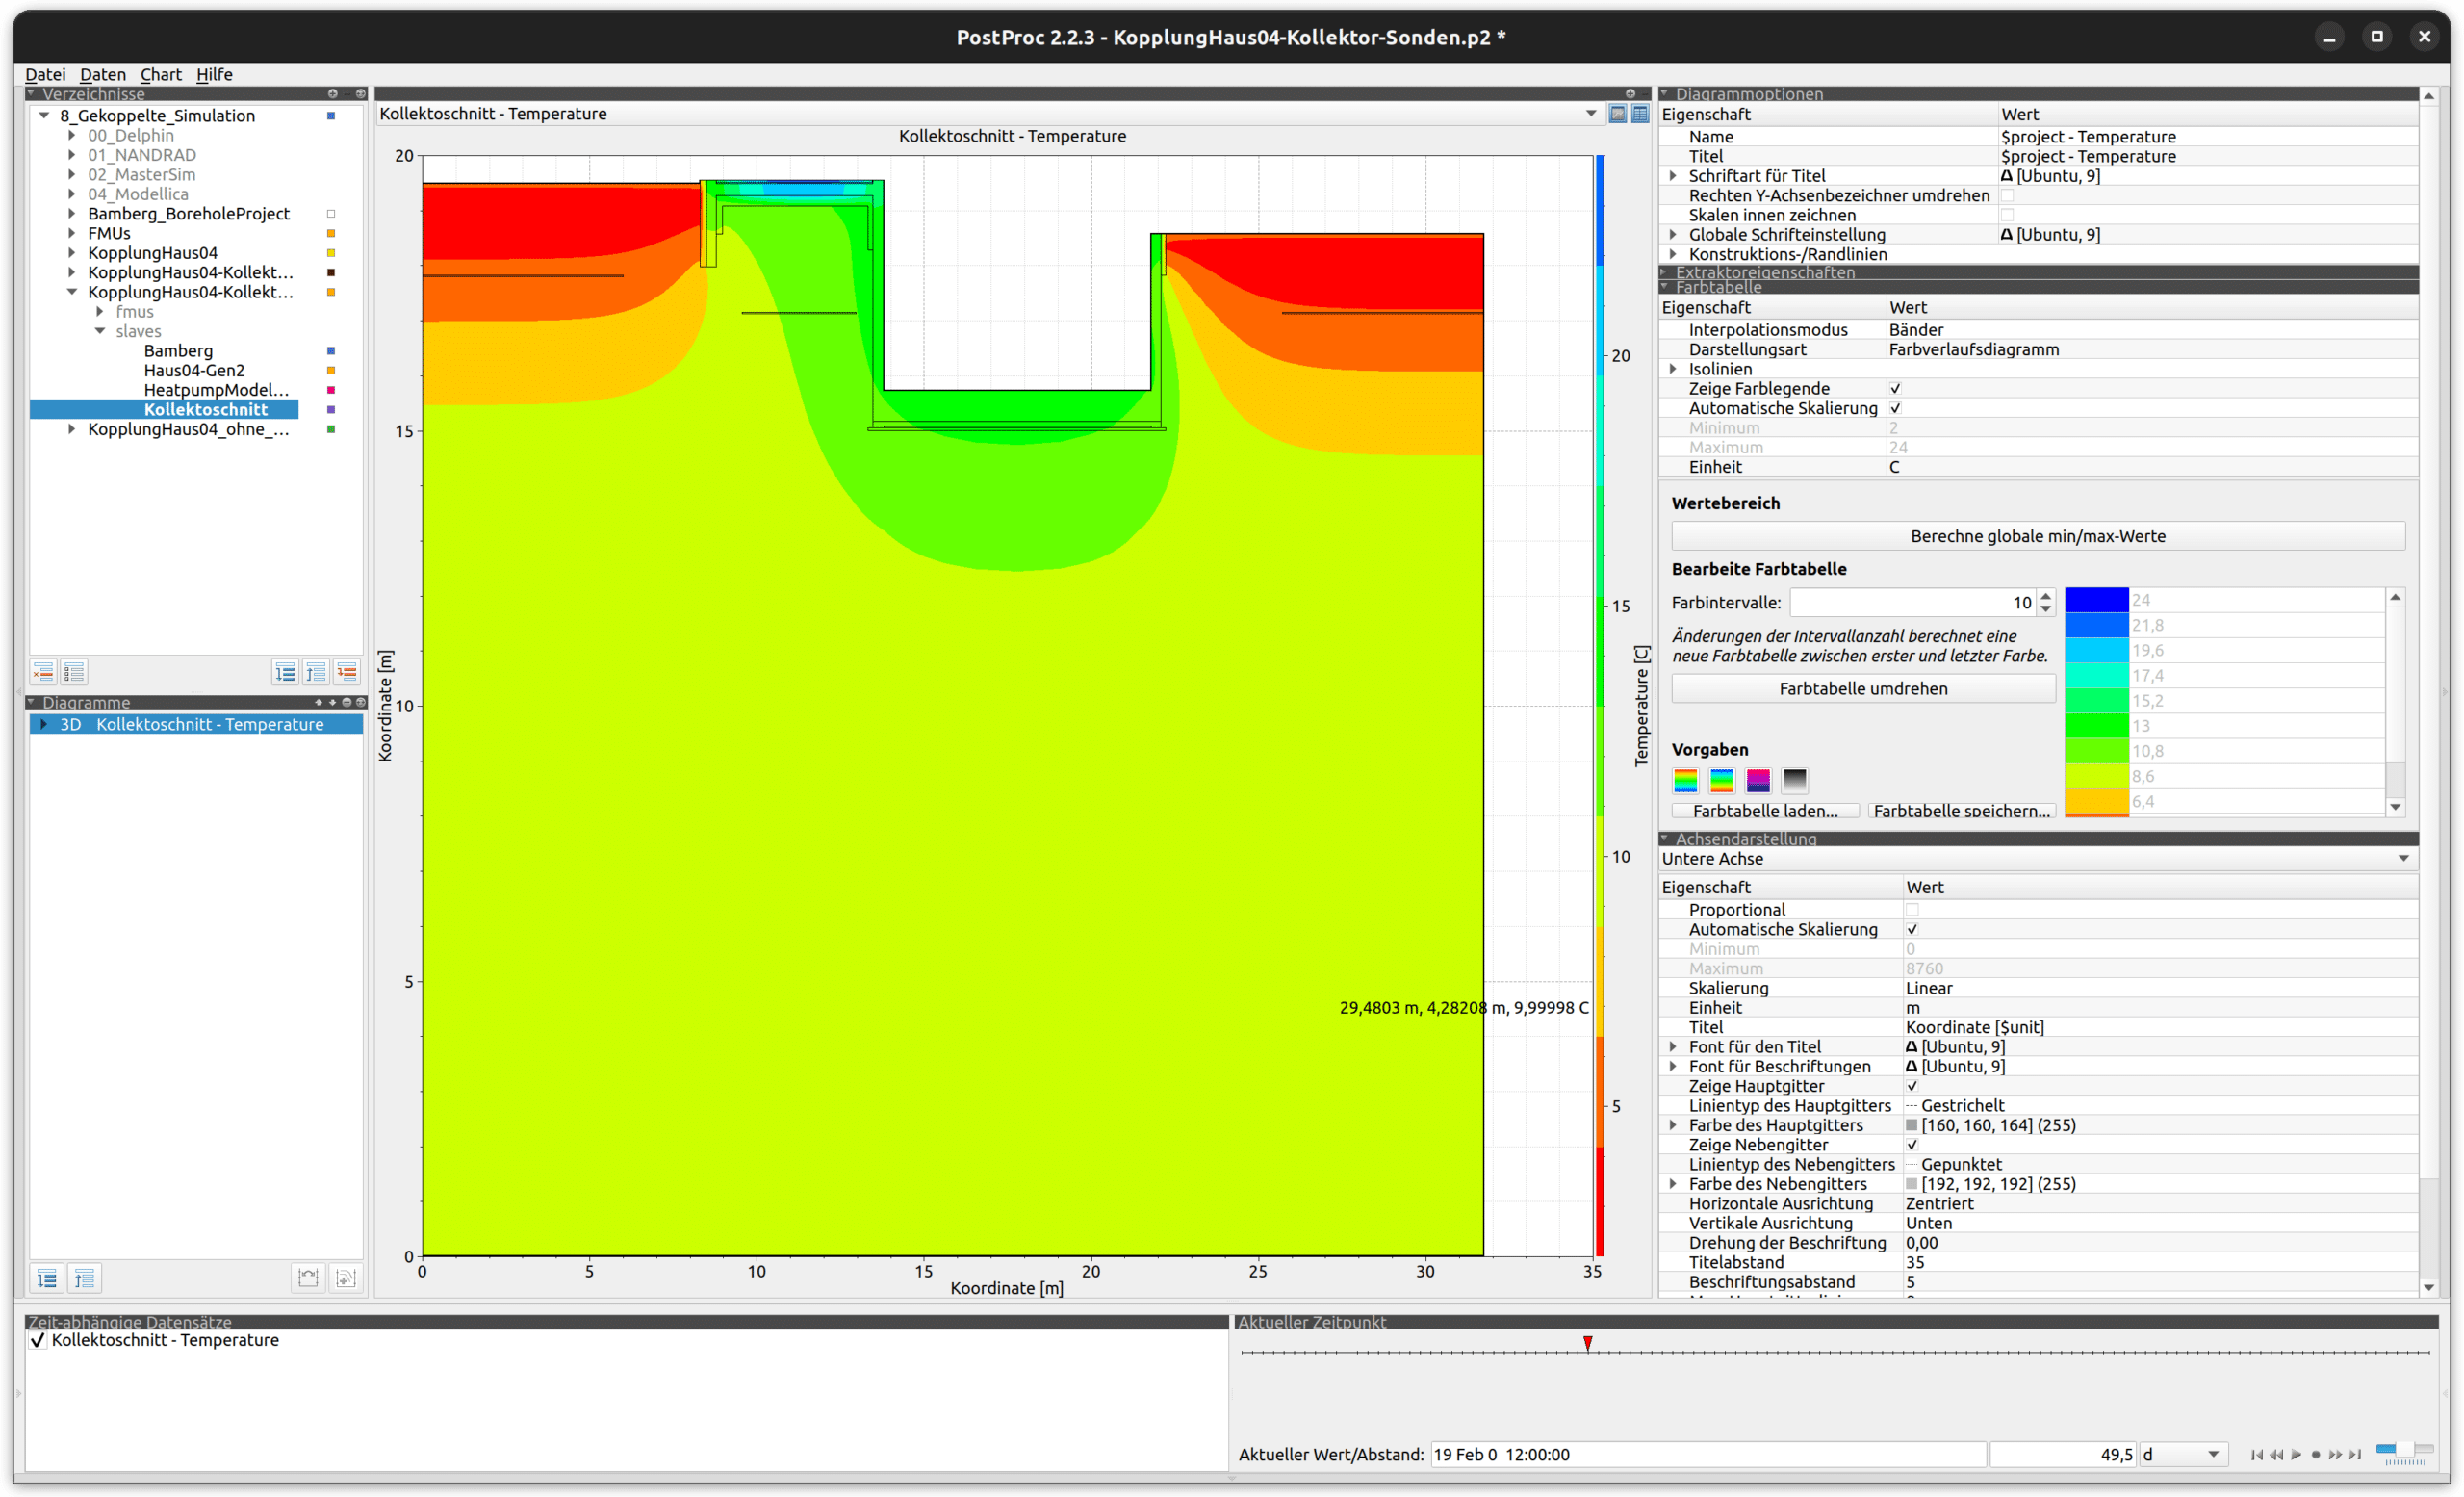
POST-PROC 2 screenshot 1POST-PROC 2 screenshot 2POST-PROC 2 screenshot 3POST-PROC 2 screenshot 4

POST-PROC 2 feature overview

For planning and engineering practice
  • Analytical post-processing of time-dependent and dynamic data
  • Import of data in different formats
  • Data display, zooming, unit conversion and linear/logarithmic axes
  • Fast diagram formatting and export to vector or bitmap graphics
  • Calculation of mold-growth criteria
  • Live view of results during simulation runs
  • Analysis of measurement and experimental data
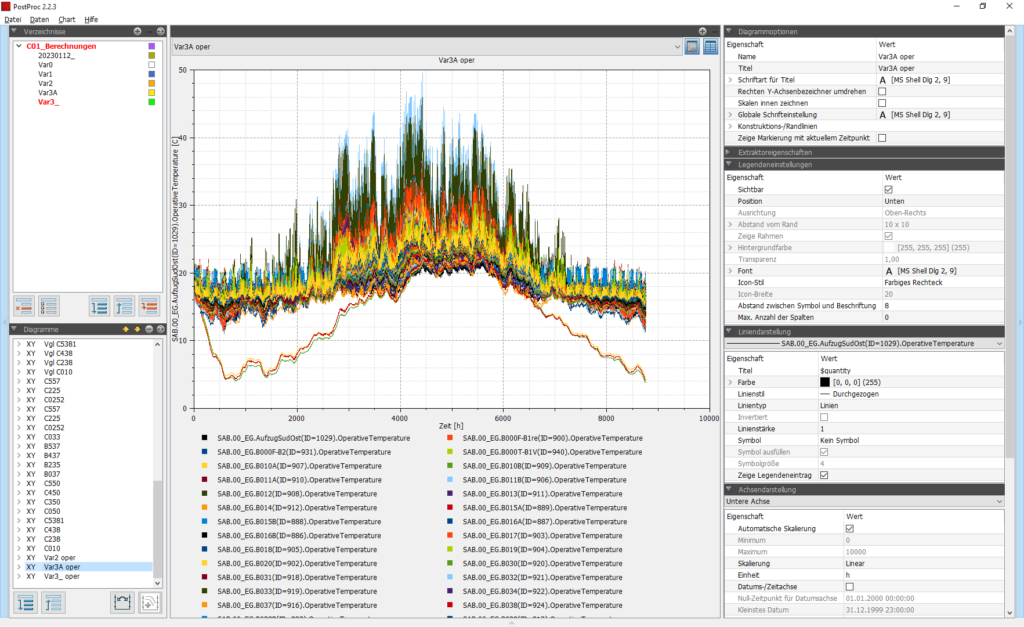
POST-PROC 2 with a time-series temperature curve
Separating data and visualization
  • Data and visualization can be updated independently
  • Session files store diagram configurations in XML format
  • Diagram configurations can be duplicated or adapted by script
  • Source data remains in external referenced files
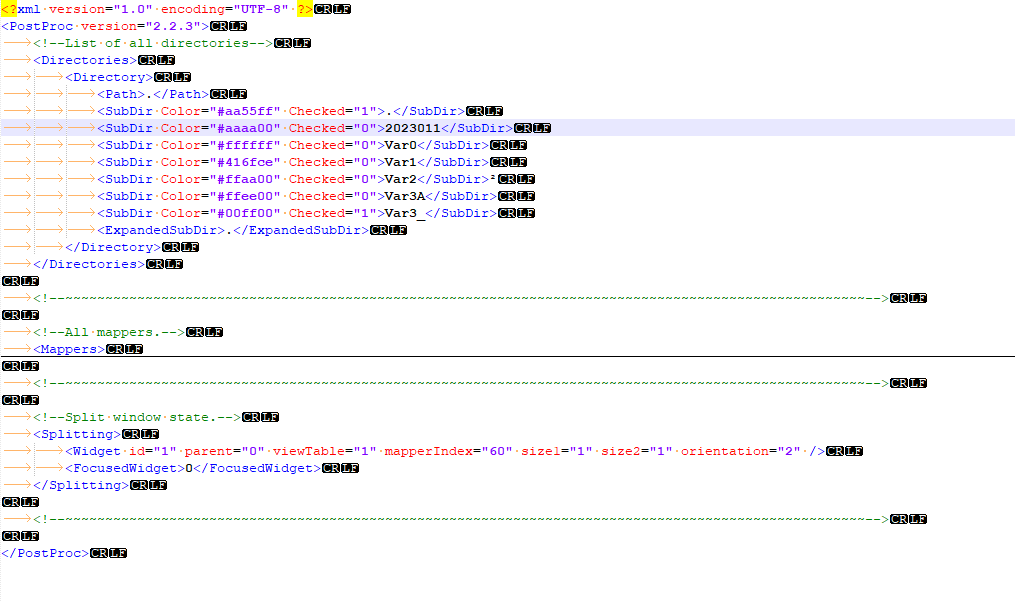
POST-PROC 2 XML session file
Static and dynamic visualization
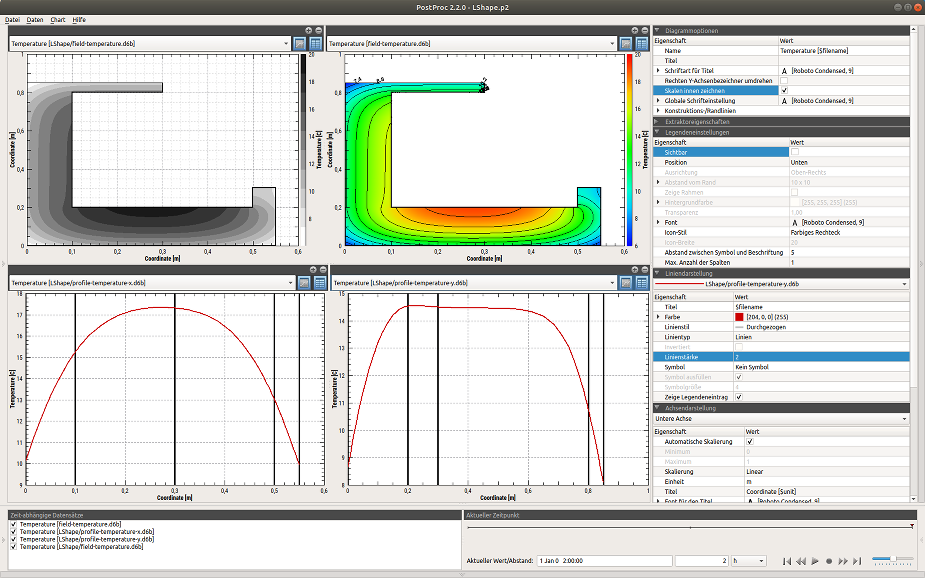
  • Different diagram types for 2D and 3D data
  • Time-value diagrams with flexible axis assignments
  • Color and isoline representation of the third dimension
  • Vector-field output and simultaneous diagram views
Configuration of diagrams
Detailed online help
  • The extensive range of functions and examples is documented in the online manual. A printable manual is also available for download.