Programmstart
Nach dem Programmstart öffnet sich zunächst das Hauptfenster mit herkömmlicher Menüleiste und darunter liegenden Werkzeugleisten, der Haupt- und Diagrammwerkzeugleiste.
Beim Anlegen eines neuen Projektes erscheint der Projekterstellungsexperte zur Eingabe von Projektinformationen.
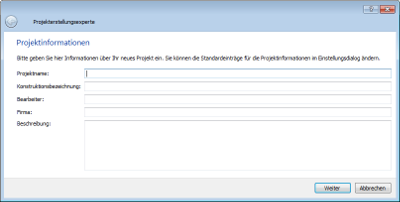
Abb. 1: Projektinformation
[Vergrößerung durch Klick auf das Bild]
Materialdatenbank
Nach der Eingabe wichtiger Projektdaten öffnet sich das Fenster der in COND enthaltenen Material- und Konstruktionsdatenbank automatisch.
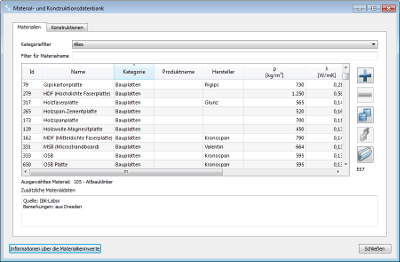
Abb. 2: Materialdatenbank
[Vergrößerung durch Klick auf das Bild]
Hier kann der Nutzer bereits eine Materialauswahl für eine erste Bauteilschicht vornehmen, die sich später problemlos wieder ändern lässt.
Die mitgelieferte Materialdatenbank ist recht umfangreich. In tabellarischer Form werden über fünfhundert Materialien entweder alphabetisch sortiert oder nach Kategorien bzw. Materialnamen gefiltert. Auch eigene Materialien und Konstruktionen lassen sich in einer Benutzerdatenbank problemlos anlegen und verwalten. Wurde ein Material ausgewählt, gelangt man im nächsten Schritt zur Hauptprogrammansicht.
Eingabe von Konstruktionen
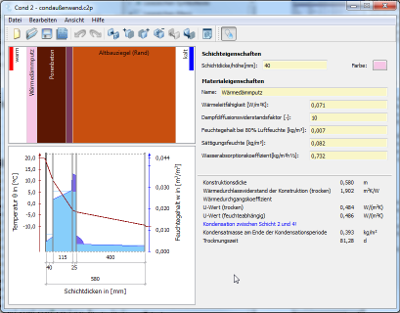
Abb. 3: Programmfenster
[Vergrößerung durch Klick auf das Bild]
Auf der linken Seite des Programmfensters befindet sich im oberen Bereich die Konstruktionsskizze, rechts davon der dazugehörige Ein- und Ausgabebereich für die Parameter des ausgewählten Materials einer Bauteilschicht. Ein weiteres Diagramm unterhalb der Konstruktionsskizze stellt die Berechnungsergebnisse, den Temperaturverlauf und die Feuchteverteilung in der Konstruktion dar. Rechts daneben sind Parameter zur Gesamtkonstruktion aufgelistet.
| | Auswahl von Klimarandbedingungen
Wählt man in der Konstruktionsskizze die warme und die kalte Luftschicht außerhalb der Konstruktion aus, verändert sich der Ein- und Ausgabebereich der Materialparameter zu einem Eingabebereich für das Berechnungsklima. Hier lassen sich unterschiedliche Klimavorgaben nach DIN 4108 oder DIN-EN-ISO 13788 sowie DIN-EN-ISO 6946 einstellen. Es besteht aber auch die Möglichkeit einer benutzerdefinierten Eingabe der Temperaturen und relativen Luftfeuchten für den Sommer sowie für den Winter. Auch eine Anpassung des Übergangswiderstandes ist an dieser Stelle möglich.
Anzeige von Berechnungsergebnissen
Der Vorteil des bei der Software eingesetzten analytischen COND-Berechnungsalgorithmus ist, dass sich jede Auswirkung von Änderungen an der Konstruktion oder den Randbedingungen stets aktuell darstellen lässt. Nach jeder Änderung erfolgt die Berechnung automatisch im Hintergrund und bleibt dem Nutzer verborgen.
Das COND Verfahren liefert Berechnungsergebnisse für alle Schichtgrenzen der Konstruktion und betrachtet darüber hinaus die Feuchteverteilung innerhalb der Bauteilschichten, die für den Nutzer gut sichtbar unterhalb der Konstruktionsskizze erscheinen.
Das Diagramm enthält den Temperaturverlauf und die Feuchteverteilung in der Konstruktion am Ende der Kondensationsperiode. Darüber hinaus werden für jede Schicht die hygroskopische Feuchte (hellblau) und das erwartete Kondensat (dunkelblau) abgebildet. Diese Art der Darstellung liefert einen sofortigen Eindruck über die Feuchtebelastung der Konstruktion und veranschaulicht eindrucksvoll den Effekt der Feuchteverteilung durch kapillare Leitung. Über die Diagrammwerkzeugleiste besteht die Möglichkeit, zwischen den Diagrammen der Feuchteverteilung sowie den Dampfdrücken in der Konstruktion zu wechseln.
Über das Menü (Bearbeiten – Kopieren bzw. Bearbeiten – Exportieren) besteht des Weiteren die Möglichkeit, die Konstruktionsskizze oder das Diagramm zur weiteren Verwendung auszugeben.
Rechts neben dem Diagramm befinden sich die berechneten Parameter zur gesamten Konstruktion. Darunter zählen die Konstruktionsdicke, der Wärmedurchlasswiderstand der Konstruktion im trockenen Zustand und die Wärmedurchgangskoeffizienten U, sowie trocken als auch feuchteabhängig. Des Weiteren gibt das Programm an dieser Stelle einen Hinweis, ob die Konstruktion durch Kondensation gefährdet ist. Als weitere hier angegebene Werte sind die Kondensationsmasse am Ende der Kondensationsperiode und die Tage der Trocknungszeit zu nennen.
Erstellen und Drucken eines Reportes
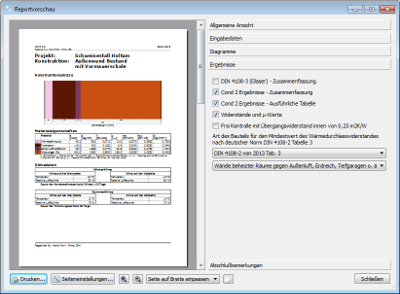
Abb. 4: Reportvorschau mit Dialog zur Ergebnisauswahl
[Vergrößerung durch Klick auf das Bild]
Die Ausgabe von Ergebnisdateien erfolgt entweder über das Menü Datei - Report Einstellungen/ Druckvorschau oder über die Symbolleiste. Das Fenster Reportvorschau (Abb. 4) beinhaltet die Druckvorschau sowie den Einstellungsdialog zur Datenausgabe. Hier lassen sich verschiedene Optionen zum Layout, den verwendeten Daten sowie deren Darstellung wählen. Im ersten Reiter „Allgemeine Ansicht“ nimmt der Nutzer Einstellungen zum generellen Seitenlayout vor, im nächsten Reiter „Eingabedaten“ wählt er die Ausgabe der Konstruktionsskizze, die Tabelle der Klimadaten, sowie die Anzeige des Übergangswiderstands an- bzw. ab. Der Reiter „Diagramme“ bietet die Möglichkeit, die Dampfdruckprofile in jeweils einem separaten Diagramm anzuzeigen. Eine Auswahl verfügbarer Möglichkeiten zur Auswertung der Ergebnisse nach DIN 4108 lässt sich im vierten Reiter „Ergebnisse“ wählen. Darüber hinaus sind hier weitere Einstellungen zur Berechnung und zur Darstellung von Ergebnissen und Werten in Form von Tabellen möglich. Diese stellen die berechneten Temperaturen, Dampfdrücke und Sättigungsdampfdrücke analog zum Glaserschema dar. Darüber hinaus geben sie aber auch Kondensatmengen innerhalb der einzelnen Schichten sowie die Ausbreitungsmaße für das Kondensat an.
Letztlich kann der Nutzer im Reiter Abschlussbemerkungen zusätzliche Informationen zum bearbeiteten Projekt eingeben, die im Ausdruck erscheinen.
|
