1. General
In this tutorial, we look at the principle steps in analyzing simulation results with the post-processing, creating of diagrams and exporting of diagrams/images for use in reports and presentations.
2. Overview
The POSTPROC 2 software has a mostly dialog-free design:
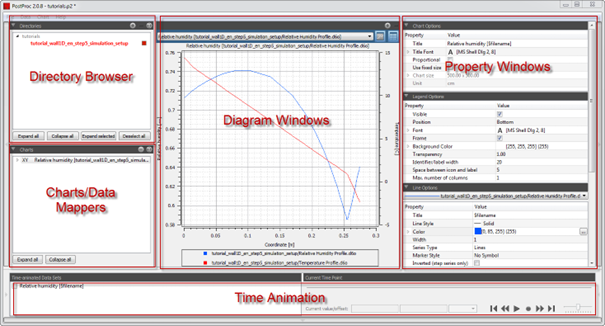
The user interface is dynamically changing, depending on user interaction:
-
The buttons at the sides of the window allow showing/hiding of windows.
-
Clicking on Directory Browser and Chart/Data Mapper windows switches the content of the central window.
-
Toggling between chart/table view is done with the chart view buttons.
2.1. Session concept
When starting the POSTPROC 2 software, by default the last session is being loaded. A session is something like a project file for post-processing results. In this tutorial we’ll start with a new session. So if there is already a session loaded, use the main menu option (File menu) to create a new session: File→New session
3. Adding Directories and Data Sets to Analyze
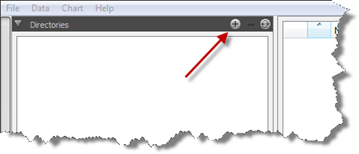
First step is always the selection of the data to be analysed. Simulation data is typically stored in multiple result files, usually with extension .out (DELPHIN 5), .d6o (DELPHIN 6 ASCII Format) and .d6b (DELPHIN 6 Binary Format). In order to generate data from these files, you need to import the directory containing these output files into the Directory Browser.
Click on the “Add directory” button
Select a directory containing output files and confirm the dialog. For DELPHIN 5 outputs select the .results folder, for DELPHIN 6 outputs you select the folder containing the log and results subdirectories.

|
When variation studies are made, many directories with output files can be stored within a parent directory. By selecting this parent directory, all subdirectories are processed recursively and any path containing output files is being added to the directory tree. |
After importing a directory or directory structure, you can expand the directory nodes to see the projects. Note, for DELPHIN 6 projects the intermediate results folder name is omitted and only the parent/project name is shown.
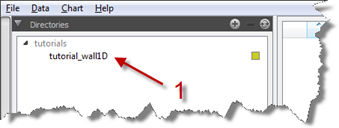
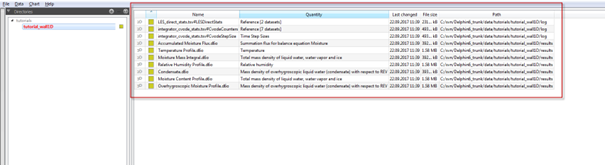
Now double-click on each project you want to analyze (1). Now all files matching the project are listed in the data manager window.
4. Creating Data Mappers and Charts
The data manager shows a list with data files and the data format: 2D, 3D, 4D, 5D or Reference.
You can now select data files to process. Use Shift-Click or Ctrl-Click to select several data files. When selecting several files, their data format should match.
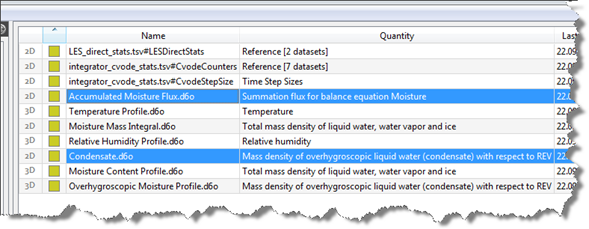
Once data file(s) are selected, the bottom part of the data manager view changes based on the data format to allow additional settings.
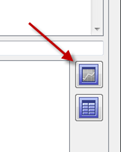
When clicking on 2D data sets you can create X-Y diagrams. You can create a chart via the chart-view button:
A chart is also named a data mapper, because it assigns parts of the data to coordinate axis. In the case of 2D diagrams, the time is being used on the X-Coordinate, and the values are shown on the Y-Axes. In a 2D diagram at most 2 different quantities can be shown.
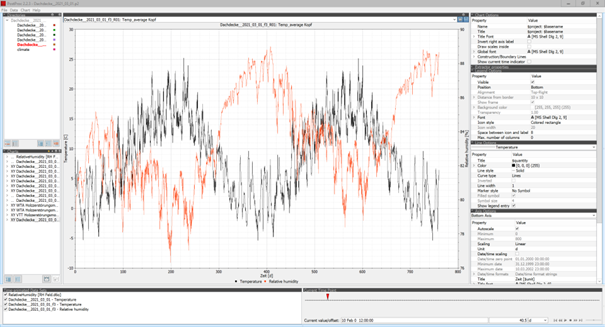
The figure above shows the resulting diagram. Changes in the representation can be made with the help of the dialogues shown on the right. Depending on the type of diagram, additional dialogues can be displayed here. Here you can see the following (right from top to bottom):
-
Diagram options
-
Global font
-
Title
-
Name of the diagram
-
-
Legend settings
-
Legend visible?
-
Position
-
Font
-
Display
-
-
Line display
-
Selection of the line (of the data set)
-
Colour, thickness, type of line
-
Symbols
-
-
Axis representation
-
Selection of the axis
-
Scaling (automatic, manual)
-
Unit
-
Number or date (if time axis)
-
Title
-
Main and secondary grid
-
Font for titles and labels The diagram manager at the bottom left shows a list of all available diagrams. Furthermore, the diagram to be displayed can also be selected in the selection box at the top of the main window (1).
-
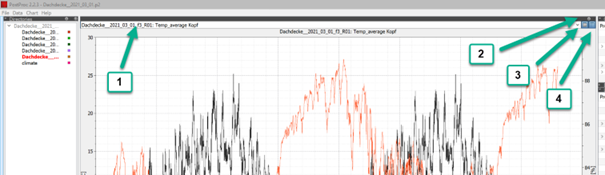
Furthermore, there are 3 more buttons at the top of the main window:
-
2 - Split the main window to display several diagrams.
-
3 - Display of the diagram
-
4 - Display of a data table
The splitting of the main window can be reached not only via the plus button (2) but also via the main menu at 'Chart'. There you can also select how a division is to take place (horizontally, vertically).