1. Overview
The aim of a DELPHIN simulation is to achieve results that can be evaluated in accordance with the problem definition. For this purpose, DELPHIN produces outputs. These are always output files that contain time-dependent values. Two main types can be distinguished:
Value outputs are generated by assigning the output to only one element or by summarising in the case of several elements (mean value, sum, maximum, minimum).
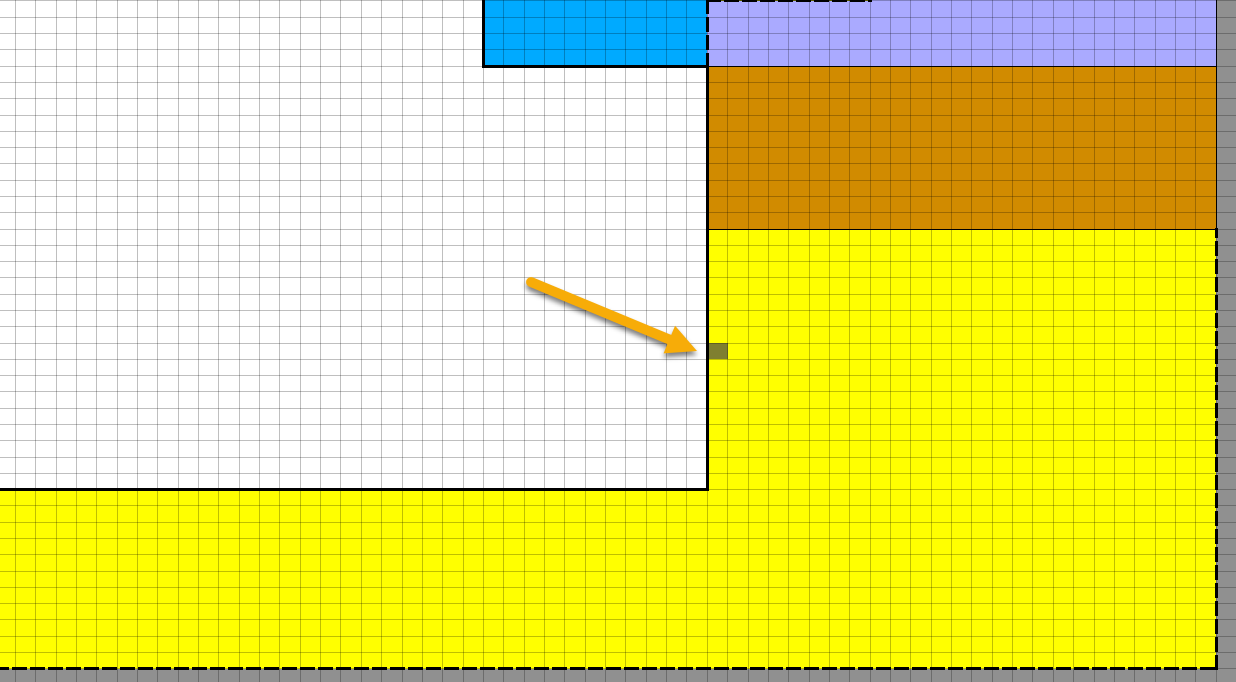
With field outputs, in addition to time and value, there are one to three coordinate axes for assigning the values to the construction. Several elements must always be selected.
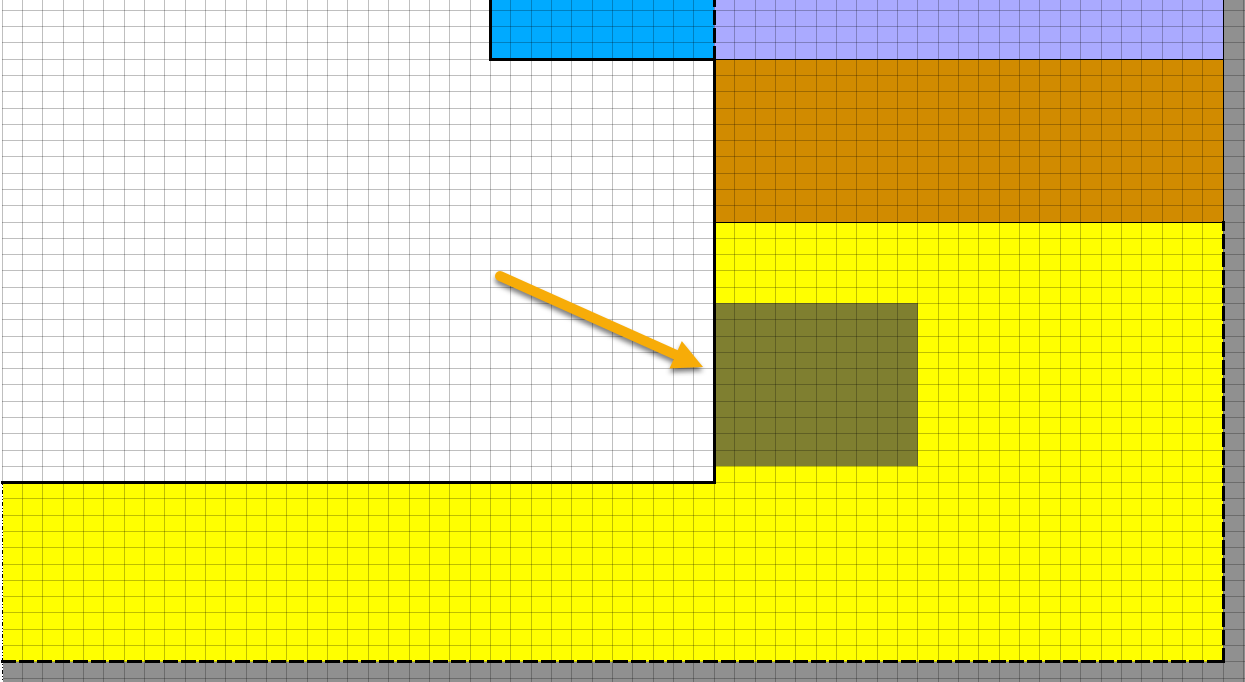
In the post-processing (PostProc 2) of DELPHIN, the following teminology is used here:
-
2D - value and time
-
3D - value, time and one coordinate
-
4D - value, time and two coordinates (from 2D simulations)
-
5D - value, time and three coordinates (3D simulations only)
3D outputs are sometimes called profiles because they can represent time-dependent profiles of quantities. By variables we mean the physical parameters that can be output in DELPHIN. We distinguish 3 main categories here:
-
Element outputs
-
State variables
-
Derived quantities
-
Material parameters
-
Mean fluxes
-
-
Fluxes
-
Boundary fluxes
-
Field fluxes
-
-
Outputs from sources/sinks
State variables are the physical quantities that are balanced and thus represent the state of the system.
-
Heat transport - internal energy
-
Moisture transport - moisture mass density
-
Air transport - air mass density
Various other variables can be derived from these state variables, such as the temperature from the internal energy. All these variables are always related to the corresponding volume elements. In this case, one also speaks of the representative elementary volume (REV). All outputs are assigned to certain transport processes, state variables or source models. They are only present if these processes are also present in the current project. The tables in the section Possible output quantitys show all outputs sorted by type and associated process.
2. Formatting
The formatting of output data in DELPHIN is divided in two subsections:
-
Data description
-
Schedule
Here, each data description is linked to a schedule and thus forms an output data record.
2.1. Data description (formatting)
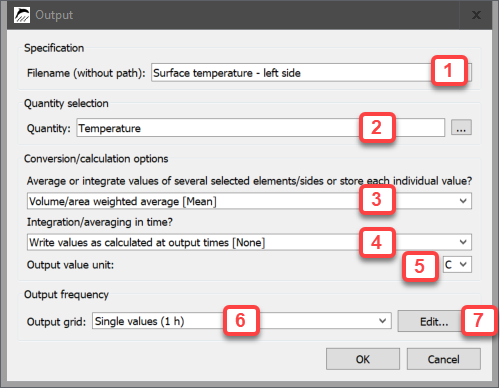
The data description contains the following information:
-
File name (1)
-
Physical quantity (2)
-
Calculation in space (3)
-
Calculation in time (4)
-
Output unit (5)
-
Schedule used (6,7)
The file name (1) can in principle be freely defined. However, the specifications of the operating system should be adhered to. In order to avoid problems when distributing or editing data files, special characters should not be used in the name. Spaces, minus or underscores should be used to separate individual words. The name should reflect the output quantity, position and formatting. This facilitates the selection for later use in post-processing.
Clicking on the button to the right of the input field for the physical quantity (2) opens a selection dialogue.
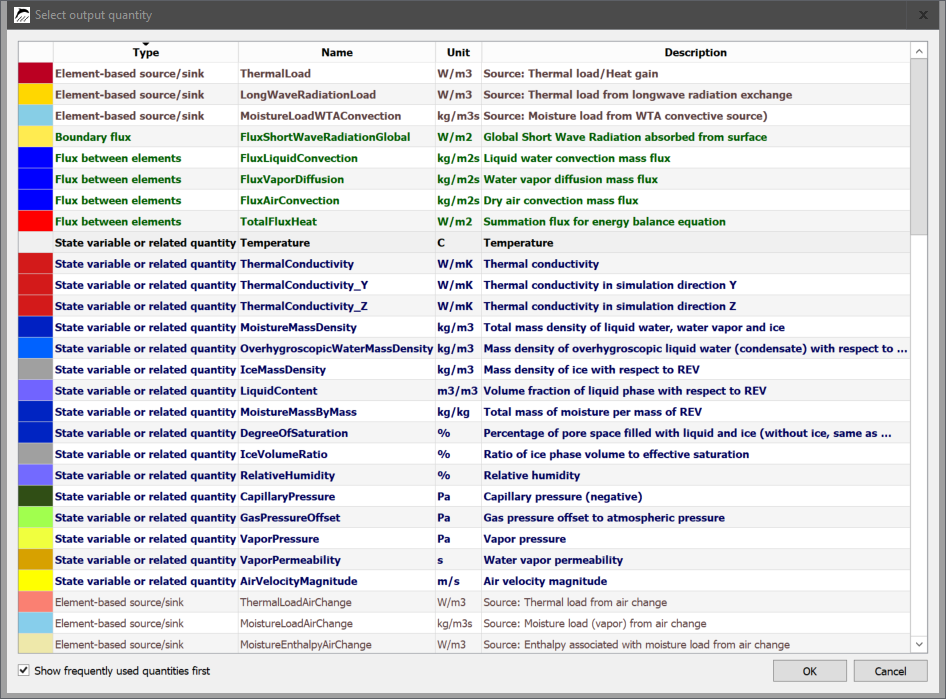
The dialogue lists all possible physical quantities, regardless of whether they are available in the concrete calculation. The type is shown in the first column. The classification is as shown in the overview. The second column contains the name of the quantity. This is a keyword in DELPHIN. An explanation of the quantity can be found in the last column and in the chapter 'Possible output quantitys'. To facilitate the selection, DELPHIN remembers the last selected quantitys and displays them in bold font at the top of the list if necessary. This behaviour can be set by using the checkbox at the bottom left of the dialogue.
In the section 'Conversion and calculation options' there are two selection boxes. The first (3) determines how the output value is calculated when assigned to several elements. The following options are available here:
-
Individual values of each selected element or side - Single
-
Volume/area weighted average - Mean
-
Volume/area weighted integral - Integral
-
Minimum value in range - Min
-
Maximum value in range - Max
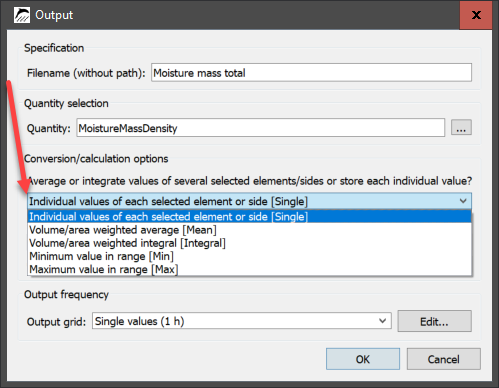
With the first option (Single), there is always a field output when assigned to several elements. This means that the values of all assigned elements are output at any time. This allows the output of spatial distributions or profiles. The type of possible charts in postprocessing depends on the number of elements selected and the type of simulation (1D or 2D). If only one element is selected, a value output will also be generated as with options 2 to 5. It is recommended to always select option 2 (mean value) for single value outputs.
If several elements have been selected, the following representations can be selected in postprocessing:
1D - Simulation
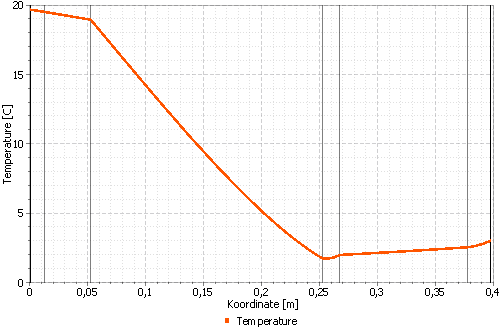
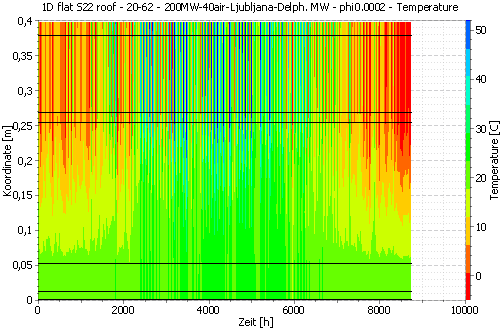
The two charts above represent the same data in two different ways.
2D simulation
In 2D simulations, the data can be represented directly only as a colour gradient at a point in time.
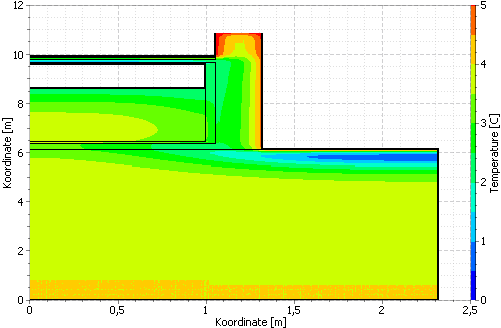
Post-processing allows even more sectional representations. More information is available in the help:
Options 2 to 5 always produce value outputs with one value per time point. These can be displayed as line diagrams (see figure below) and are well suited to show changes over time.
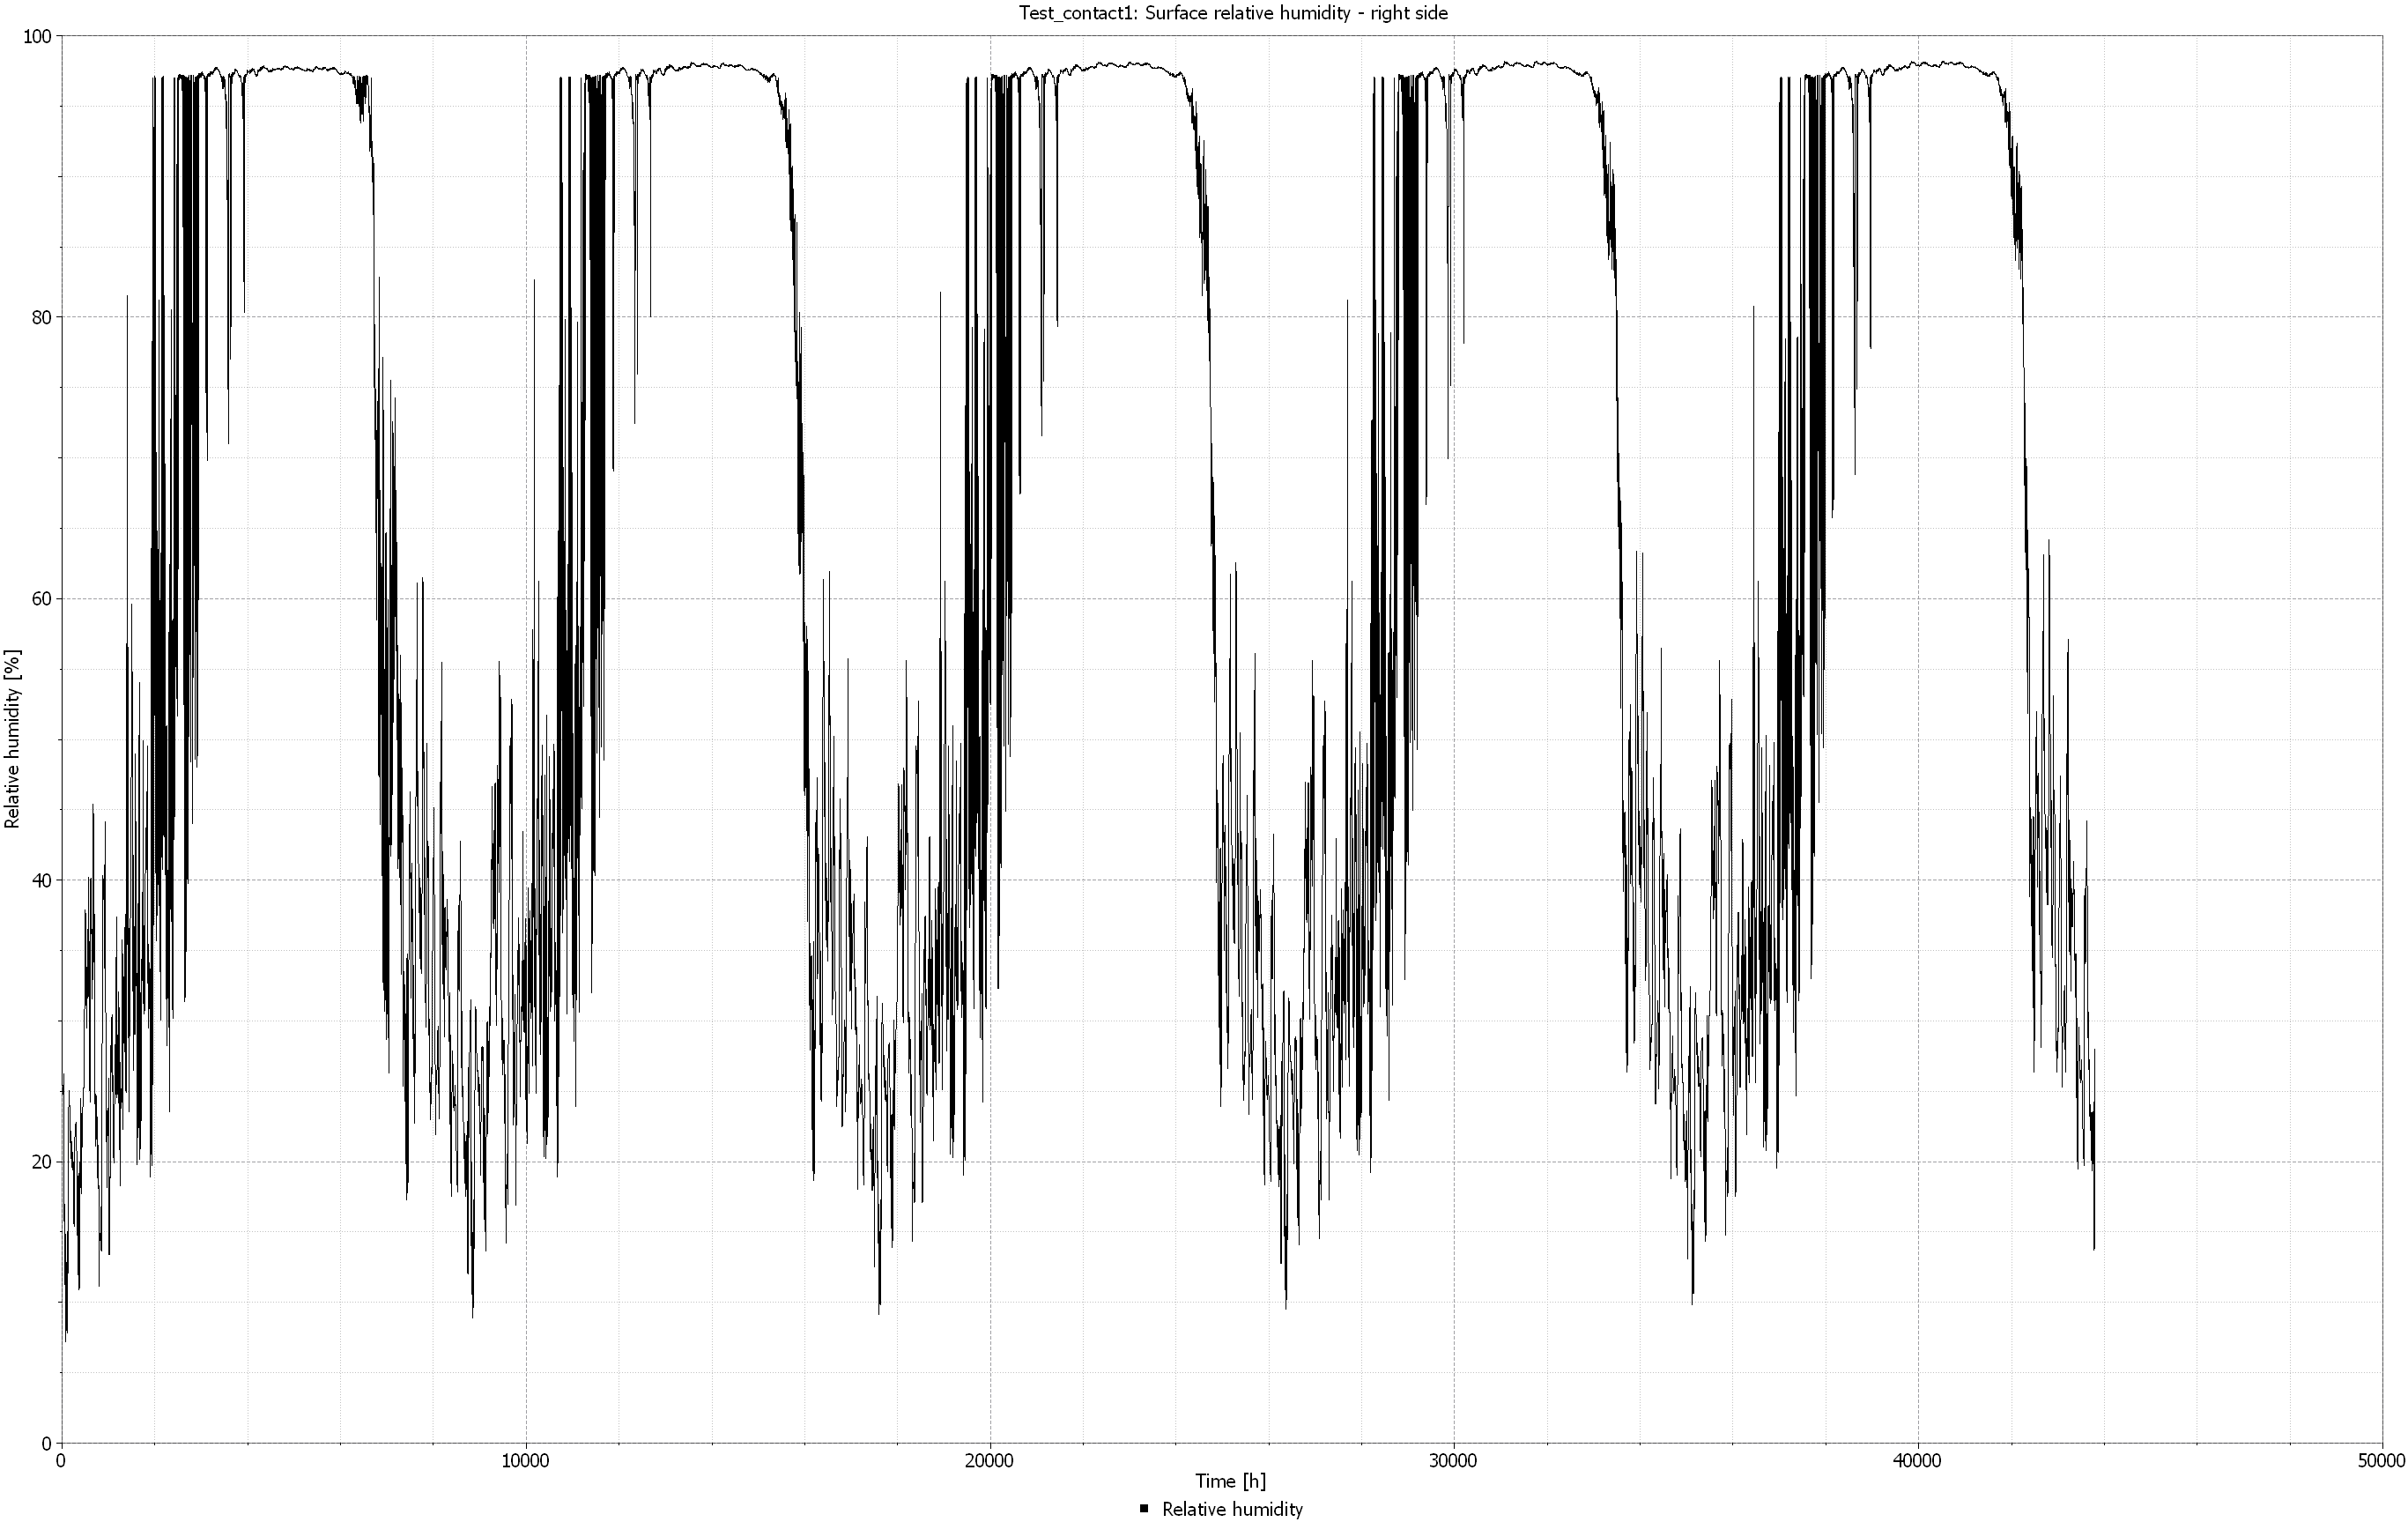
Such outputs are also needed for the damage models contained in the post-processing.
Option 3 is a special case here, because here the sum of the phyical quantity is formed over all selected elements. Of course, this is only possible for summable quantities, such as masses. For non-sumable quantities, such as temperature, this option is not offered. The unit of the output variable is then also adapted. E.g. the unit of the water mass density would be kg/m3. If a spatial integral is selected here, it becomes the water mass in the unit kg for the assigned area.
Options 4 and 5 provide the minimum and maximum values of the assigned area. This can be particularly interesting for damage modelling for worst-case analyses.
The second selection box (4) determines the calculation options for the time course. The following variants can be selected:
-
Write values as calculated at output times - None
-
Averaging values in time - Mean
-
Integrating values in time - Integral
-
Minimum value within simulation interval - Min
-
Maximum value within simulation interval - Max
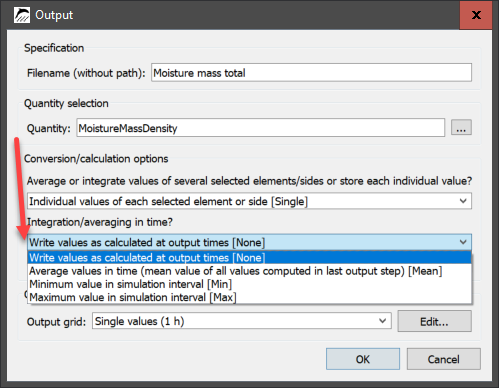
When creating new outputs, variant 1 is always used by default.
With variant 2, an average value is formed over the time steps set in the schedule. The values for the internal time steps of the solver are used for this. Variants 4 and 5 are calculated similarly. Here, the respective minimum or maximum value is output over the time step. With small output step widths (⇐1h), there is usually hardly any difference to the normal output.
Time integration is only available for flow outputs. Here, the values are also added up to the internal solver time steps and divided by the time step length. The unit is adjusted in the process. E.g. for an output of the heat flux density, W/m2 changes to J/m2.
The one-page setting (5) only affects the unit of the physical quantity. The time unit is set in DELPHIN in the model options.

A time schedule (output grid) must be assigned to each data description. Selection field 6 allows a choice of an existing schedule or the creation of a new one. To create, select 'Select or create new…' from the list.
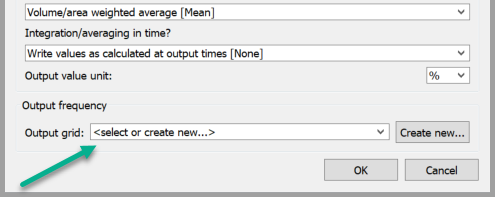
Then the label of the button to the right of the selection field changes to 'Create New…'. Clicking on the button 'Edit' or 'Create new…' opens the dialogue for editing the schedule.
2.2. Schedules / Output grids
Any number of output grids can be created. However, only two are recommended for most simulations.
-
a coarse grid for field outputs (several outputs per time) - e.g. 1.5 d
-
a fine grid for value outputs (one value per time) - e.g. 1 h
For the coarse grid, always take a time step that contains a 12h value (0.5d, 1.5d, 2.5d) in order to avoid that the output always came at 00:00. The 12h section then always alternates the output at midnight and noon. The output grid shown above is also used in the project wizard for the standard outputs.

The above image shows the list of output grids available in a project. Click on the green plus sign to create a new grid. Then the dialogue shown in the following picture opens.
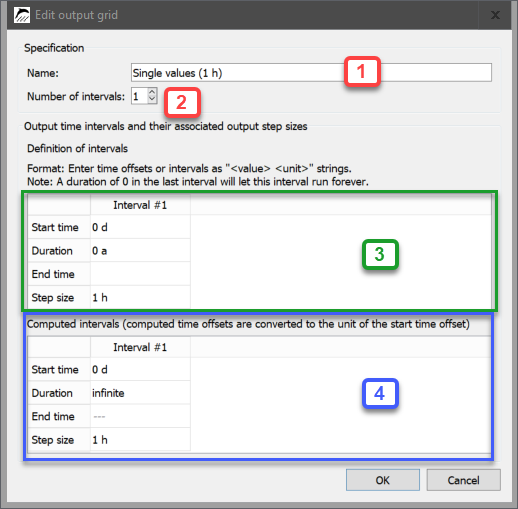
The dialogue shown above allows the setting of an output schedule. This can consist of several intervals. Each interval is identified by the start, the duration and the time grid.
The name is defined in input line 1. This can be any name, but should reflect the time grid to make the selection easier. The output grid shown above has the name '1h' because it has hourly time steps.
In field 2 you specify the number of intervals present. One-interval grids are usually used.
Then there are two list elements in the dialogue. The first (green frame - 3) is for entering the interval parameters. In the lower area (blue frame - 4) the intervals are only displayed.
In the input area one can set the following parameters (always number - space - unit):
-
Start time - start of the interval
-
Simulation duration or end time
-
only one of the two values must be entered
-
If 0 (any unit) is entered for the simulation duration, there is no end time point. The interval always goes to the end of the simulation.
-
-
Step size
The output grid shown in the picture above has the following properties:
-
an interval
-
starts at the beginning of the simulation
-
goes to the end of the simulation
-
outputs are made every hour
Output grids with multiple intervals are useful for very long simulations to reduce the amount of output data. The following figure shows an example:
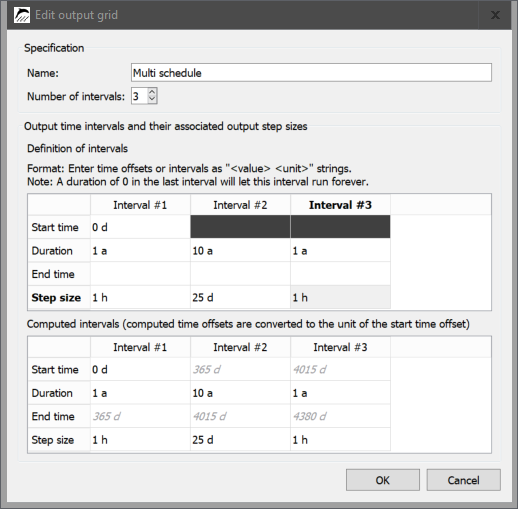
This output grid is intended for simulations with more than 12 years. In the first year there is a finer output (every hour). In the next 10 years, outputs are only written every 25 days. At the end it goes back to hourly values. From interval 2 onwards, no more starting points are set to ensure that the entire simulation period is covered. You should always enter 0 as the duration in the last interval to avoid missing outputs at the end. The calculated start and end times are then shown in the lower list field for checking.
3. Create and assign
In versions up to 6.1.2, help for creating outputs is only available in the wizard for a new project. Otherwise, outputs can be created individually in the project.
3.1. Creation with the project wizard
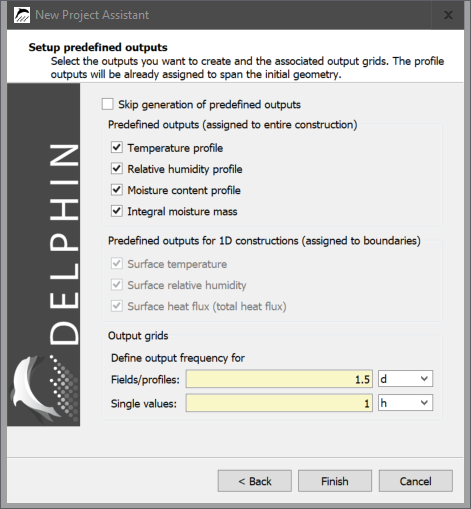
When a new project is created in DELPHIN, the project assistant opens first. It guides the user to the new project in several steps. Step 5 allows the selection of predefined outputs. The display is different for 1D and 2D simulations. The following section deals with a 1D simulation.
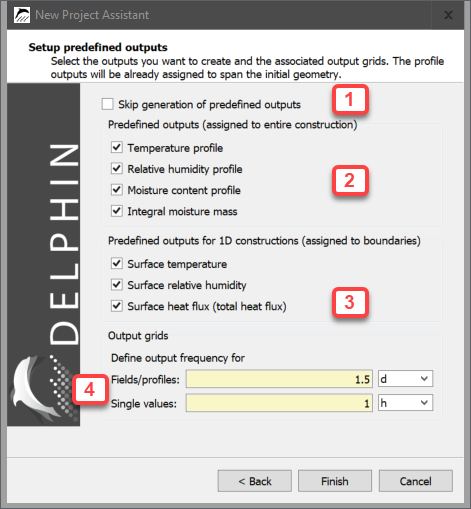
Setting 1 allows to skip the creation of predefined outputs.
Section 2 creates outputs that affect the entire structure. There are 3 profiles (or fields) for temperature, relative humidity and moisture content as well as an integral moisture content (total moisture content). The integral moisture content represents the sum of the moisture contents of all elements of the construction (water, vapor, ice). These 4 outputs should exist in every DELPHIN simulation. Especially the integral moisture content is important to represent the long-term behaviour of the construction. Does the moisture increase more and more or does the moisture content level off at a certain level after a few years?
Area 3 allows the creation of outputs for the surfaces (inside and outside). The temperature and relative humidity on the surface and the heat flux density over the boundaries are offered here. Especially important here is usually temperature and relative humidity at the inner surface. These data can be used e.g. for dynamic mould models to prove the minimum thermal insulation. The transmission heat loss can be derived from the heat flux density (preferably also inside). After confirming this dialogue, one continues with the project wizard. After completion, the new project is displayed in DELPHIN. The output data are usually shown in the upper right corner of the window.
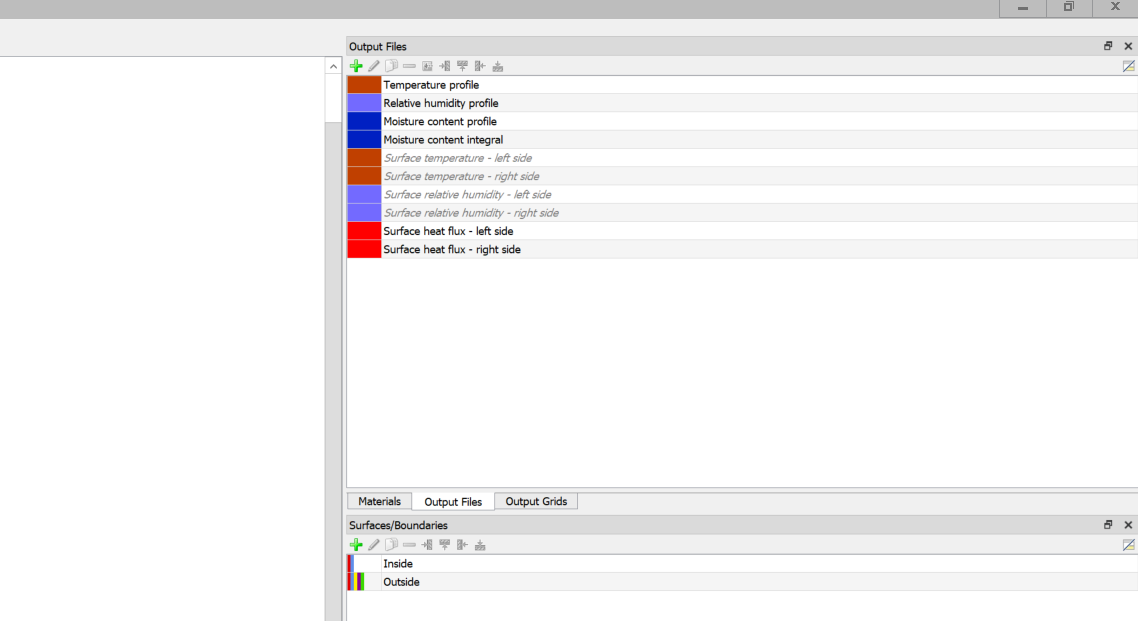
In the image above you can see black and bold and grey and italic data. The outputs shown in black are generated and already assigned to the construction. By clicking on a data set, the assignment is highlighted in the construction window. The first 4 data sets are assigned to the entire construction.
The following 4 outputs for temperature and relative humidity on the surfaces have been created but not yet assigned. This must now be done (see picture below). To do this, first mark the corresponding boundary element (1), then the output you want to assign (2) and finally click on the green 'Assign'-button (3).
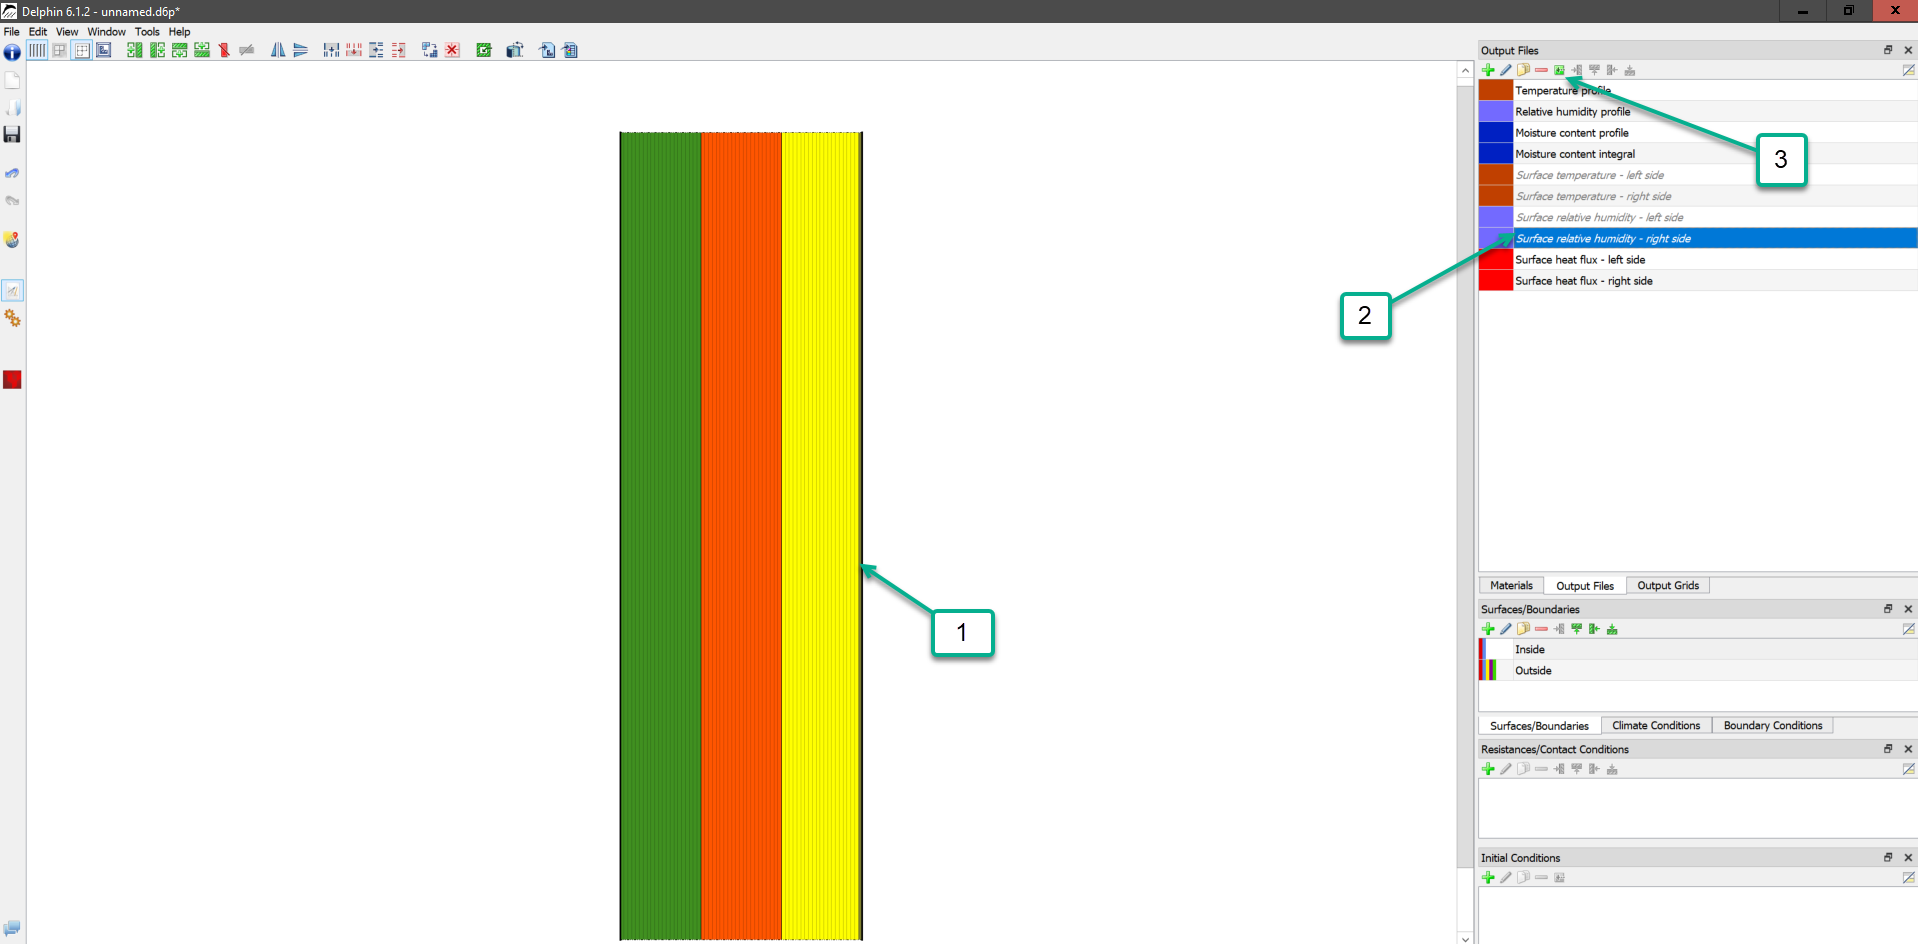
In the case of the surface outputs, it would be good to adapt the output file names in this case in order to emphasise more clearly what they represent. For example, by default, one surface temperature is called 'Surface temperature - left side'. The left side of this construction is the surface for outside. Therefore, it would be better to rename the output to 'Surface Temperature Outside'.
For 2D constructions, the output section in the project wizard changes in that the outputs for the surfaces are no longer offered (see picture below). This is because in 2D constructions there is no longer a clear allocation of surfaces and adiabatic surfaces are possible. Surface outputs, like all other outputs, must be added later.
3.2. Direct output creation
Outputs can be created directly by adding them to the output list or by copying existing outputs. To create outputs, proceed as follows:
-
Click on the Add button of the output list.
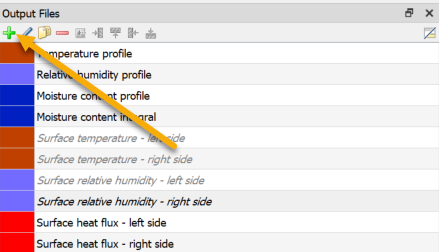
-
Configure the output in the format dialogue.

-
Assign the new output to the design (Assignment).
Instead of creating a new output, you can also copy an existing one and then adapt it. This procedure is advantageous if the new output is similar in format (physical quantity, formatting, schedule) to the existing one. To copy, select an existing output and click on the 'Copy' button.
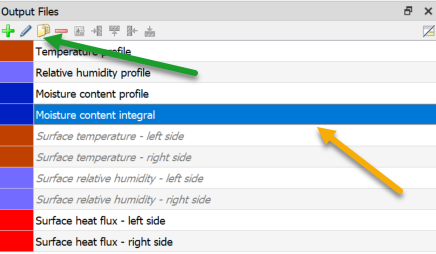
It is especially important to define a new name. In a DELPHIN project, there must never be two outputs with the same name so that the output files are named differently. If this should happen, an error message will be displayed at the start of the simulation and the calculation will be aborted.
4. Possible output quantities
This list is valid for version 6.1.6. Older versions may contain fewer output quantities.
4.1. Element outputs
4.1.1. Heat transport
| No. | Name | Unit | Explanation |
|---|---|---|---|
1 |
Temperature |
C |
Temperature |
2 |
EnergyDensity |
J/m3 |
Energy Density |
Transport Parameter |
|||
3 |
ThermalConductivity |
W/mK |
Thermal conductivity in general or in direction X |
4 |
ThermalConductivity_Y |
W/mK |
Thermal conductivity in calculation direction Y |
5 |
ThermalConductivity_Z |
W/mK |
Thermal conductivity in calculation direction Z |
-
the energy density (2, internal energy) is the current state variable.
-
The temperature (1) is calculated from this via the material- and moisture-dependent heat storage function.
-
The thermal conductivity depends on the parameters or functions set in the material of the selected elements (moisture content, temperature). The conductivities in Y- and Z-direction (4, 5) are only different from the normal conductivity if the material is parameterised anisotropically.
4.1.2. Moisture transport
| No. | Name | Unit | Explanation |
|---|---|---|---|
6 |
MoistureMassDensity |
kg/m3 |
Total mass density of liquid water, water vapour and ice |
7 |
OverhygroscopicWaterMassDensity |
kg/m3 |
Mass density of overhygroscopic water (condensate) related to REV |
8 |
LiquidMassDensity |
kg/m3 |
Mass density of liquid water related to REV |
9 |
VaporMassDensity |
kg/m3 |
Mass density of the gas phase related to REV |
10 |
IntrinsicVaporMassDensity |
kg/m33 |
Mass density of water vapour related to gas volume (absolute humidity) |
11 |
LiquidContent |
m3/m3 |
Volume fraction of the liquid phase related to the REV |
12 |
MoistureMassByMass |
kg/kg |
Mass density of total moisture related to REV |
13 |
DegreeOfSaturation |
% |
Percentage of pore space filled with water and ice (without ice exactly like LiquidVolumeRatio) |
92 |
DegreeOfSaturationOver30 |
% |
Percentage of pore space filled with water and ice above 30%. |
14 |
LiquidVolumeRatio |
% |
Ratio of the volume of the liquid phase to the effective saturation (degree of saturation) |
15 |
RelativeHumidity |
% |
Relative air humidity |
16 |
LiquidPressure |
Pa |
Pressure of the liquid phase |
17 |
TotalLiquidPressurePotential |
Pa |
Liquid Water Pressure Potential with Gravity |
18 |
CapillaryPressure |
Pa |
Capillary pressure (negative) |
19 |
VaporPressure |
Pa |
Vapour pressure |
IceMass |
|||
20 |
IceMassDensity |
kg/m3 |
Mass density of ice related to REV |
21 |
IceVolumeRatio |
% |
Ratio of ice volume to effective saturation |
91 |
IceCriteriaDIN4108_3 |
% |
By how much does the current saturation level exceed 30% when the temperature is ⇐ -5°C at the same time? |
Transport parameter |
|||
22 |
KirchhoffPotentialLiquidFlux |
- |
Kirchoff Potential, integral of liquid water conductivity versus liquid pressure |
23 |
KirchhoffPotentialLiquidFlux_Y |
- |
Kirchoff potential, integral of liquid water conductivity versus liquid pressure in calculation direction Y |
24 |
KirchhoffPotentialLiquidFlux_Z |
- |
Kirchoff potential, integral of liquid water conductivity versus liquid pressure in calculation direction Z |
25 |
LiquidPermeability |
s |
Liquid water conductivity in general or in direction X |
26 |
LiquidPermeability_Y |
s |
Liquid water conductivity in calculation direction Y |
27 |
LiquidPermeability_Z |
s |
Liquid water conductivity in calculation direction Z |
28 |
VaporPermeability |
s |
Water vapour conductivity in general or in direction X |
29 |
VaporPermeability_Y |
s |
Water vapour conductivity in calculation direction Y |
30 |
VaporPermeability_Z |
s |
Water vapour conductivity in calculation direction Z |
-
The moisture mass density (6) is the primary state variable. All other quantities are derived from it.
-
the conversion to relative humidity and capillary pressure is done via the moisture storage function of the material and is independent of temperature
-
the vapour pressure results from the relative humidity at the temperature of the element
-
-
The mass density of the overhygroscopic water (7) denotes the amount of moisture that lies above the hygroscopic limit value. By default, this is the water content at 95% relative humidity. However, this value can be changed in the options of DELPHIN.
-
Data for ice (20, 21) are only available if ice calculation is switched on in the DELPHIN calculation options.
-
The degree of saturation (13) is the ratio of total moisture content to effective saturation of the respective material. It plays a role especially in ice damage assessment according to WTA 6.5 or DIN 4108-3 D.
-
The mass-related moisture content (12) is important in the assessment of timber components (DIN 68800-2).
-
Quantities 91 and 92 have been available since version 6.1.5
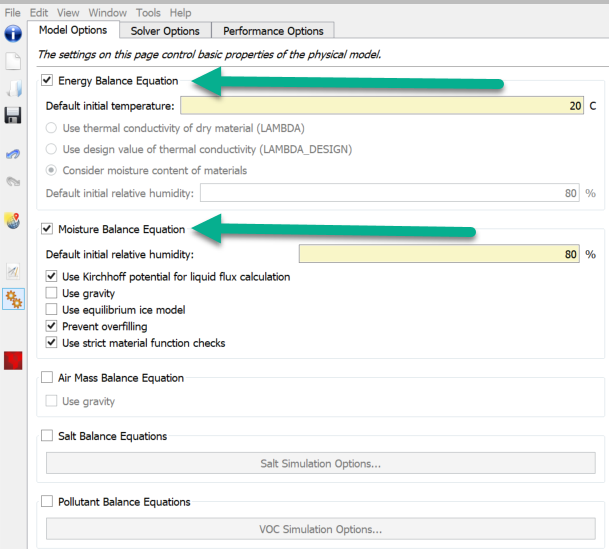
All parameters of the moisture transport are only available if the moisture balance is switched on in the DELPHIN calculation options.
4.1.3. Air transport
| No. | Name | Unit | Explanation |
|---|---|---|---|
90 |
GasMassDensity |
kg/m3 |
Total mass density of gas |
31 |
GasPressure |
Pa |
Gas pressure (total pressure) |
32 |
GasPressureOffset |
Pa |
Gas pressure difference to atmospheric pressure (101325 Pa) |
Transport parameter |
|||
33 |
AirPermeability |
s |
Air permeability in general or in direction X |
34 |
AirPermeability_Y |
s |
Air permeability in calculation direction Y |
35 |
AirPermeability_Z |
s |
Air permeability in calculation direction Z |
36 |
AirVelocityMagnitude |
m/s |
Mean air velocity |
If the air balance is activated in DELPHIN, the outputs from the table above are available.
-
The state variable for this transport would be the gas mass density.
-
Quantity 36 (mean air velocity) allows the distribution of the flow velocity in a construction to be output as a field. To calculate this quantity, the flows are vectorially averaged over all sides of each volume element and an average velocity is determined from this.
4.1.4. Salt transport
| No. | Name | Unit | Explanation |
|---|---|---|---|
37 |
WaterActivity |
- |
Water Activity |
38 |
Molality |
mol/kg |
Molality of dissolved salts |
39 |
IntrinsicSolutionDensity |
kg/m3 |
Density of the salt solution related to the liquid volume |
40 |
SolutionMassDensity |
kg/m3 |
Mass density of the salt solution related to REV |
Transport parameter |
|||
41 |
SaltDiffusionCoefficient |
m2/s |
Diffusion coefficient of salt in porous material for gradient of molality |
4.1.5. VOC Transport
| No. | Name | Unit | Explanation |
|---|---|---|---|
42 |
PartialPressureVOC |
Pa |
Partial pressure of VOC |
43 |
IntrinsicVOCDensity |
kg/m3 |
Specific VOC density in the gas phase in kg(VOCg)/m3(gas) |
44 |
VOCMassDensityGas |
kg/m3 |
Mass density of VOC in the gas phase |
45 |
VOCMassDensityAdsorbed |
kg/m3 |
Mass density of the solid phase of VOC |
Transport parameter |
|||
46 |
VOCPermeability |
s |
VOC/pollutant conductivity in the gas phase |
The salt transport and VOC calculations require additional material parameters which are not available for many materials. At present, an application should only be made in the scientific field.
4.2. Outputs for fluxes
| No. | Name | Unit | Explanation |
|---|---|---|---|
HeatConduction |
|||
47 |
FluxHeatConduction |
W/m2 |
Heat flow (conduction) |
48 |
TotalFluxHeat |
W/m22 |
Sum of all heat flows |
Moisture transport |
|||
49 |
FluxEnthalpyLiquidConvection |
W/m2 |
Enthalpy flow for liquid water convection |
50 |
FluxEnthalpyVaporConvection |
W/m2 |
Enthalpy flux for water vapour convection |
51 |
FluxEnthalpyVaporDiffusion |
W/m2 |
Enthalpy flux for water vapour diffusion |
52 |
FluxLiquidConvection |
kg/m2s |
Convective mass flow for liquid water |
53 |
FluxVaporDiffusion |
kg/m2s |
Mass flux for water vapour diffusion |
54 |
TotalFluxMoisture |
kg/m2s |
Sume of all moisture fluxes |
Air transport |
|||
55 |
FluxEnthalpyAirConvection |
W/m2 |
Enthalpy flux for convection of dry air |
56 |
FluxVaporConvection |
kg/m2s |
Mass flux for convection of water vapour |
57 |
FluxAirConvection |
kg/m2s |
Convective mass flux for dry air |
Salt transport |
|||
58 |
FluxEnthalpySaltDiffusion |
W/m2 |
Enthalpy flux for salt diffusion |
59 |
FluxEnthalpySaltConvection |
W/m2 |
Enthalpy flux for salt convection |
60 |
FluxSaltDiffusion |
kg/m2s |
Mass flux for salt diffusion |
61 |
FluxSaltConvection |
kg/m2s |
Mass flux for salt convection |
VOC transport |
|||
62 |
FluxVOCDiffusion |
kg/m2s |
Mass flow for VOC diffusion |
63 |
FluxVOCConvection |
kg/m2s |
Mass flow for VOC convection |
The outputs for fluxes described above can be assigned both at the boundary and in the field. Here, the sign rule must be observed:
-
in the field: positive from left to right, from bottom to top, from front to back.
-
at the boundary: positive into the construction
If an assignment contains sides both at the boundary and in the field, the assignment rule for the field applies.
-
Size 48 contains all possible heat fluxes, i.e. the heat conduction itself pluss all existing enthalpy fluxes.
-
the fluxes for vapour convection (50) corresponds to the vapour fraction in air movement and is thus only present in air transport calculations
| No. | Name | Unit | Explanation |
|---|---|---|---|
Boundary condition shortwave radiation |
|||
64 |
FluxShortWaveRadiationDirect |
W/m2 |
Direct shortwave solar radiation absorbed by the surface |
65 |
FluxShortWaveRadiationDiffuse |
W/m2 |
Diffuse shortwave solar radiation absorbed by the surface |
66 |
FluxShortWaveRadiationGlobal |
W/m2 |
Global shortwave solar radiation absorbed by the surface |
Boundary condition longwave radiation |
|||
67 |
FluxLongWaveRadiation |
W/m2 |
Longwave radiation |
Boundary condition driving rain |
|||
68 |
FluxRain |
kg/m2s |
Rain flow absorbed by the surface |
69 |
FluxRainNormal |
kg/m2s |
Rain flow normal to surface |
70 |
FluxEnthalpyRain |
W/m2 |
Rainfall enthalpy |
71 |
FluxRainRunoffCooling |
W/m2 |
Heat flux for cooling by running off rain |
Boundary condition heat flux |
|||
88 |
FluxHeatConductionGain |
W/m^2 |
Heat flux density with positive heat flux |
89 |
FluxHeatConductionLoss |
W/m^2 |
Heat flux density with negativ heat flux |
The flux outputs described above are linked to the specific boundary conditions mentioned.
-
the short-wave radiations (64 - 66) are to be understood as normal radiation of the respective surface multiplied by the absorption coefficient.
-
quantity 67 contains the total long-wave radiation balance at the assigned surface (irradiation - emission).
-
FluxRain (68) is the liquid water flow absorbed by the surface element. This checks how much water is impinging (69) and how much can be absorbed at the current moisture content.
-
FluxRainNormal (69) is the amount of driving rain impinging normal to the surface calculated according to the model of ISO 15927-3.
-
FluxEnthalpyRain (70) is the enthalpy flow caused by FluxRain.
-
In the case that not all of the driving rain can be absorbed, the remaining part is considered as runoff. The enthalpy of this runoff is represented by FluxRainRunoffCooling (71). Since the temperature of the rain is usually lower than the surface temperature, there is a cooling effect.
-
Quantities 88 and 89 have been available since version 6.1.6
4.3. Outputs for sources and sinks
| No. | Name | Unit | Explanation |
|---|---|---|---|
Single energy source |
|||
72 |
ThermalLoad |
W/m3 |
Source: Heat load/Heat source |
Long-wave radiation exchange in a cavity |
|||
73 |
LongWaveRadiationLoad |
W/m3 |
Source: Heat load due to long-wave radiation exchange |
Air exchange with ambient air … |
|||
74 |
ThermalLoadAirChange |
W/m3 |
Source: Heat load due to air exchange |
75 |
MoistureLoadAirChange |
kg/m3s |
Source: moisture load (steam) due to air exchange |
76 |
MoistureEnthalpyAirChange |
W/m3 |
Source: Enthalpy due to moisture load during air exchange |
Moisture source due to air flow as a result of air leakage according to WTA 6.2 |
|||
77 |
MoistureLoadWTAConvection |
kg/m3s |
Source: Enthalpy due to moisture load during air exchange |
78 |
MoistureEnthalpyWTAConvection |
W/m3 |
Source: Enthalpy of moisture load by convective source according to WTA 6.2 |
Single Moisture Source |
|||
79 |
MoistureLoad |
kg/m3s |
Source: moisture load/liquid water source |
80 |
MoistureLoadEnthalpy |
W/m3 |
Source: enthalpy of moisture load/liquid water source |
81 |
SaltProductionRateBoundWater |
kg/m3s |
source: mass production rate of bound water from dissolved salt |
82 |
SaltProductionRateEnthalpy |
W/m3 |
Source: Enthalpy due to isothermal solution or crystallisation of salt |
Water flow in one direction through the structure |
|||
83 |
ThermalLoadGroundWaterFlow |
W/m3 |
Source: Thermal load/heat source due to injected groundwater |
Simple VOC/pollutant source |
|||
84 |
VOCAdsorptionRate |
kg/m3s |
Source: Mass production rate of the solid phase of VOC by condensation from the gas phase |
85 |
VOCDesorptionRate |
kg/m3s |
Source: mass production rate of the gas phase of VOC by emission from the solid phase |
86 |
VOCLoadAirChange |
kg/m3s |
Source: VOC mass concentration source due to air exchange |
87 |
VOCSource |
mg/m3s |
Source: VOC mass production rate from specified emission source |
All source outputs described above are determined by the assigned named source models. The assignment to the design must be made to volume elements to which a source model is also assigned. Each assignment thereby defines its own outputs.
5. Which outputs are needed?
When creating a DELPHIN project, the question always arises which outputs are needed. Ultimately, the solution results from the task itself.
Why do I carry out this calculation?
What statements do I want to make?
The standard outputs should always be present. If the project was created using the project wizard, they are usually present (if not deselected).
For all other outputs, one must consider what statement is to be made. Mostly, calculations are supposed to make statements about the functionality of a construction. For this purpose, one can ask the following questions:
-
How does the moisture behave over time?
-
Moisture mass integral of the entire construction
-
-
What damage can occur in this construction?
-
What expenditure do I need to determine a case of damage?
-
Where, in the construction, could this damage occur?
-
The most common damage assessments are:
-
Mould on the internal surface
-
Average temperature (1) and humidity (15) at the surface where mould is expected to occur.
-
in PostProc 2 different mould models are available (isopleths, viitans)
-
-
Algae formation on the outside
-
average temperature (1) and humidity (15) at a location on the outside
-
in PostProc 2 there is an experimental algae model for brick facades
-
Test on longer periods with high surface humidities at temperatures above 0°C can provide an indication of algae formation
-
-
Wood-damaging fungi in wooden building components
-
mean temperature (1) and humidity (15) at all positions in timber components where damage can be expected
-
do not choose the area of allocation too large to avoid errors due to averaging
-
for worst-case consideration, Maximum (air humidity) can also be selected here instead of mean value
-
in PostProc 2 2 different damage models are available (WTA 6.8, Viitanen)
-
-
mass-related moisture content (12) in the wood
-
can be used for evaluation according to DIN 68800-2 as well as WTA 6.8
-
the range should be selected as for temperature and humidity
-
-
-
Ice formation in the construction
-
for the damage model according to DIN 4108-3 D.7.5 one needs the degree of saturation (13) and the temperature (1) in a 1x1cm2 area (2D calculation)
-
for this ice calculation does not need to be activated
-
-
further possibilities are the output of the pore volume ratio for ice as well as the ice content (no damage model available)
-
ice calculation must be activated for this
-
-
For other possible moisture damage (corrosion, source/shrinkage, dissolution, etc.), no good damage models exist yet.