1. Overview
Air convection can transport more moisture in building components than vapor diffusion. Normally, there are leakages in all building components that can lead to air flow. This effect is particularly important in lightweight structures. For this reason, DIN 68800-2, for example, requires a drying reserve for wooden structures, which should allow to dry out these convectively transported moisture quantities again. Here, however, one refers to the simplified diffusion scheme (Glaser method). In order to be able to represent this effect also in hygrothermal simulations, there are in principle two possibilities:
-
Calculate the air flow through the construction
-
Use of a simplified source model
The current standards favor the source model. The physical principles for this can be found, for example, in WTA leaflet 6.2 chap. 5.2. The model has the following properties:
-
a condensation area must be defined in the construction in which moisture is likely to condense as a result of air flow.
-
the amount of condensation results from:
-
tightness of the construction
-
pressure difference between inside and outside
-
vapor content of the indoor air
-
temperature in the condensation area
-
-
the flow direction is always from inside to outside
-
any drying caused by this air flow is not taken into account
The condensation area must be determined by the user. This is usually on the cold side of the insulation materials used. E.g. in case of an unventilated flat roof, a one cm high area can be chosen on the upper side of the insulation layer directly under the cover board.
The tightness of the construction is defined in DIN 4108-3 as follows:
-
without air tightness test: 0.007m3/(m2hPa)
-
with air tightness test and q50 ≤ 3m3/(m2h): 0.004m3/(m2hPa)
A pressure difference between inside and outside can be produced by two effects:
-
buoyancy calculated from inside and outside air temperatures
-
imposed by mechanical ventilation system
The vapor content of the indoor air results from the indoor climatic conditions. The temperature in the calculation area is calculated by the simulation program. DELPHIN uses the minimum of the temperature in the condensation area here.
2. Use of a source in DELPHIN
In the following, the generation and use of such a moisture source is shown using the example of an unventilated flat roof. The following figure shows the setup and dimensions.
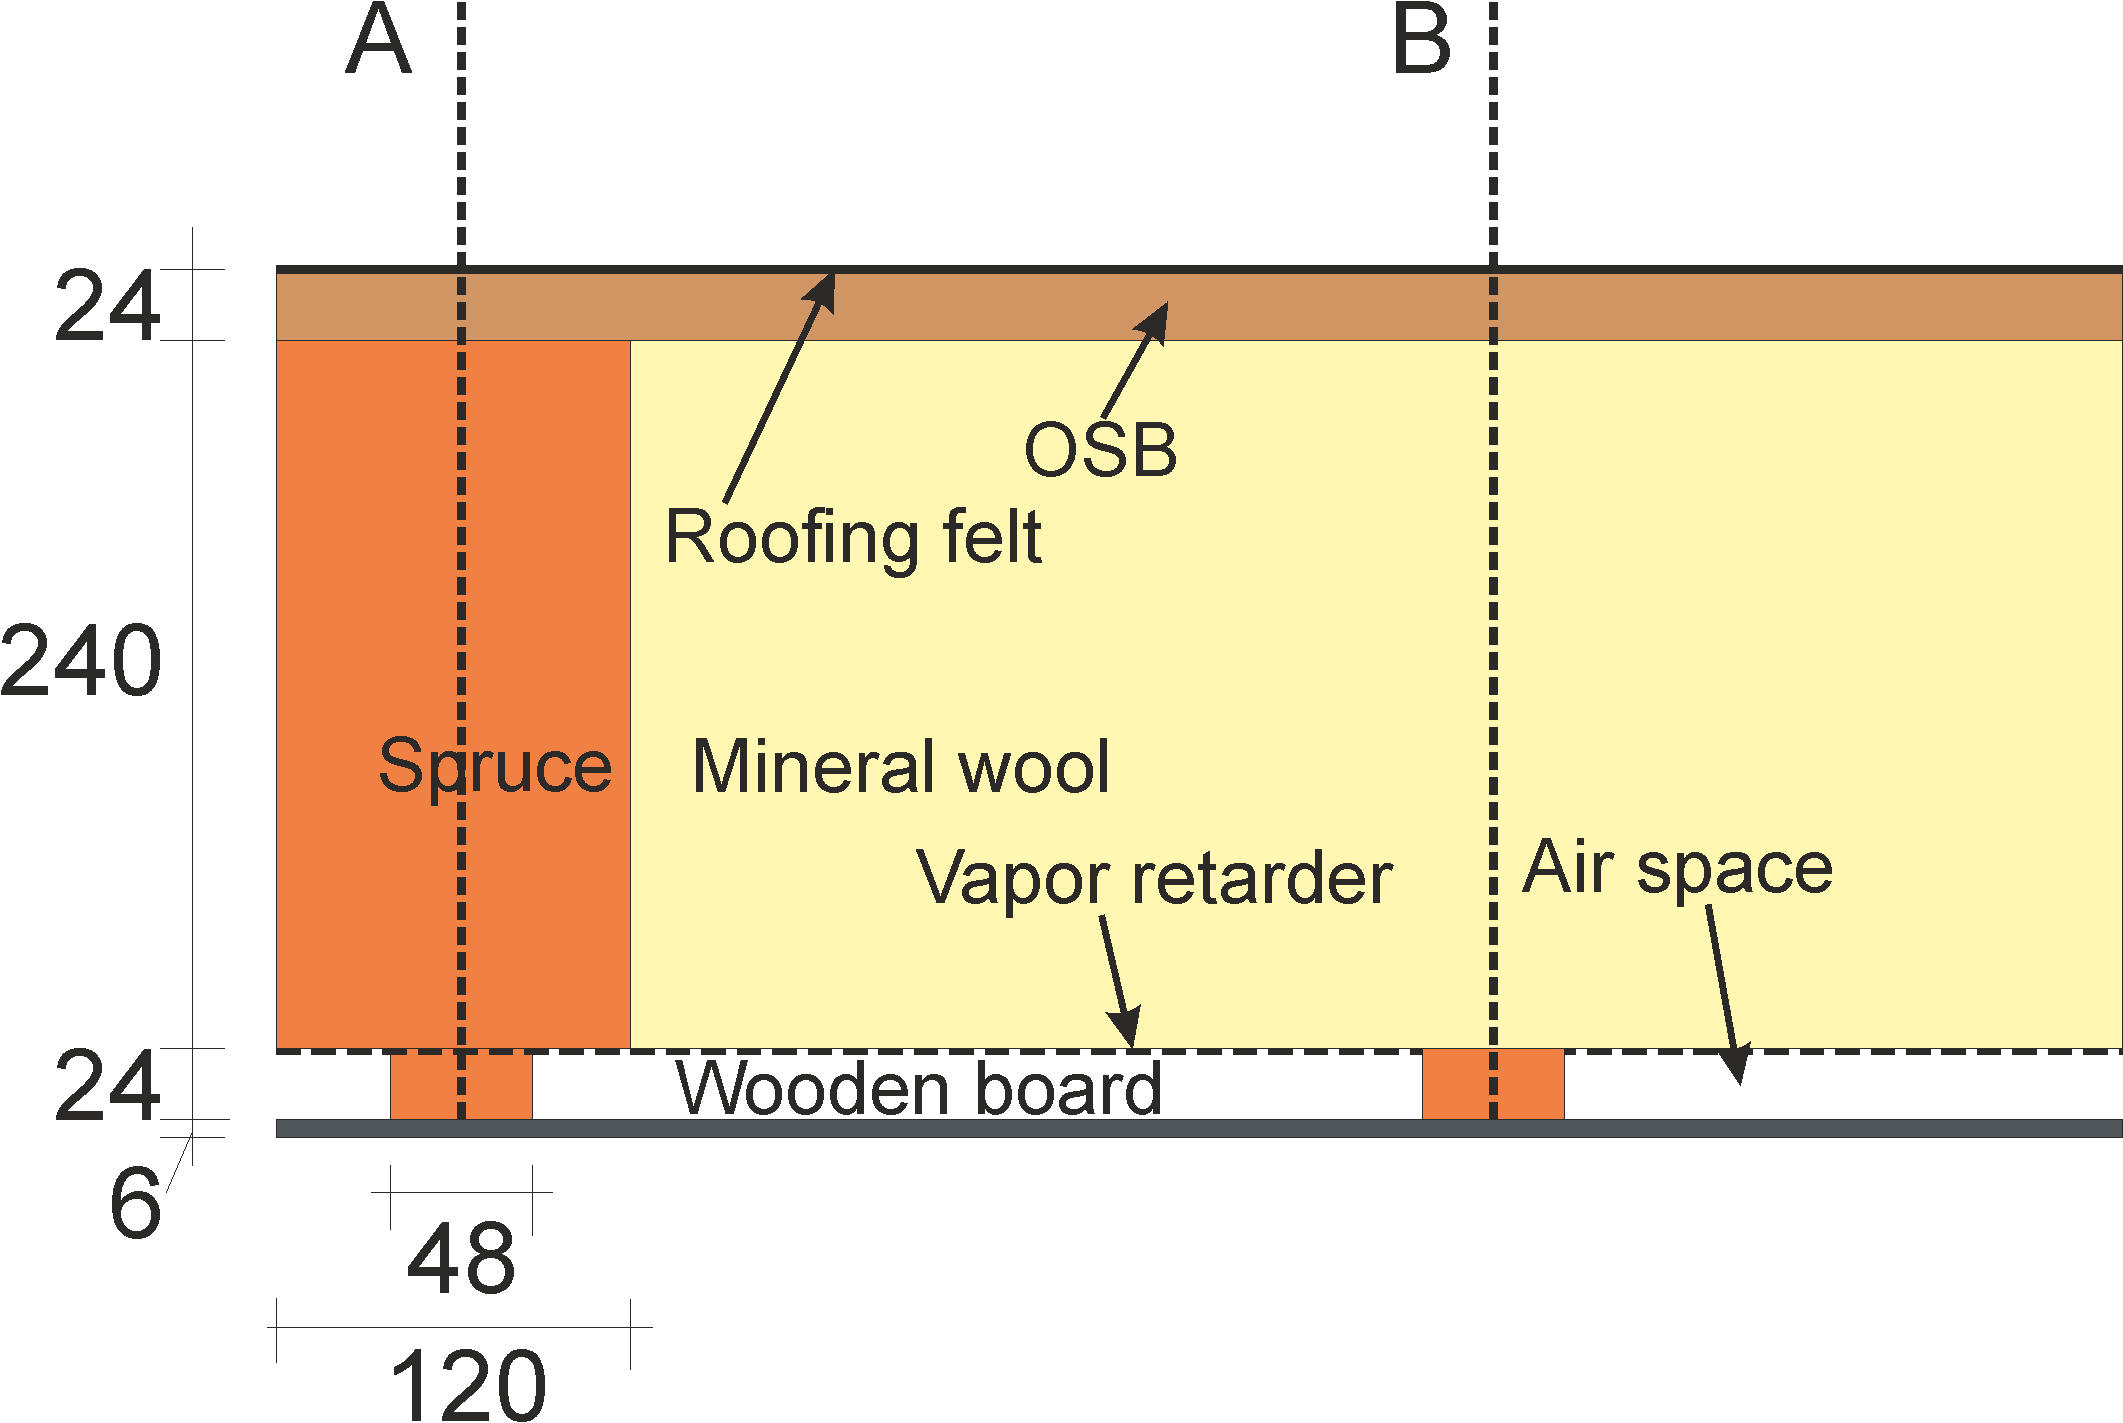
Only the area between section planes A and B is used for the calculation. The upper side of the mineral wool insulation directly under the OSB board is considered as a possible condensation area.
2.1. Creating the source
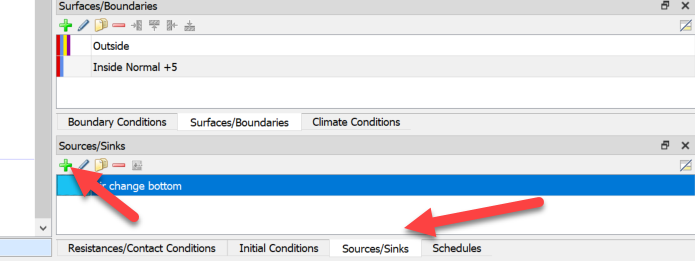
First, the source has to be defined in DELPHIN. Here it is necessary that the interior and exterior climate (surfaces) are already defined. Then create a source by clicking on the green plus button in the sources/sinks area.
Then a dialog for defining the properties appears. As type you choose 'Moisture source due to airflow caused by air leakage according to WTA 6.2'. The name can be chosen arbitrarily. Then the climate data (green frame) and the parameters (red frame) must be defined.
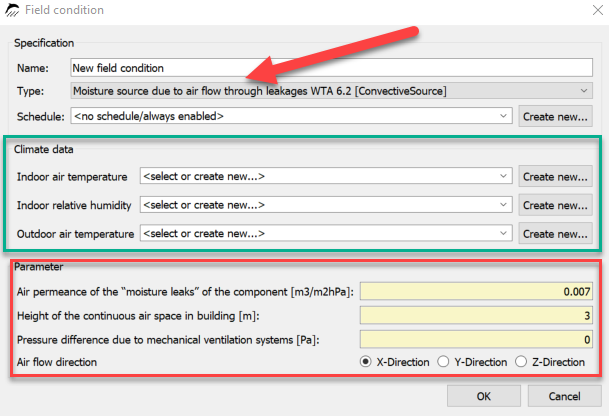
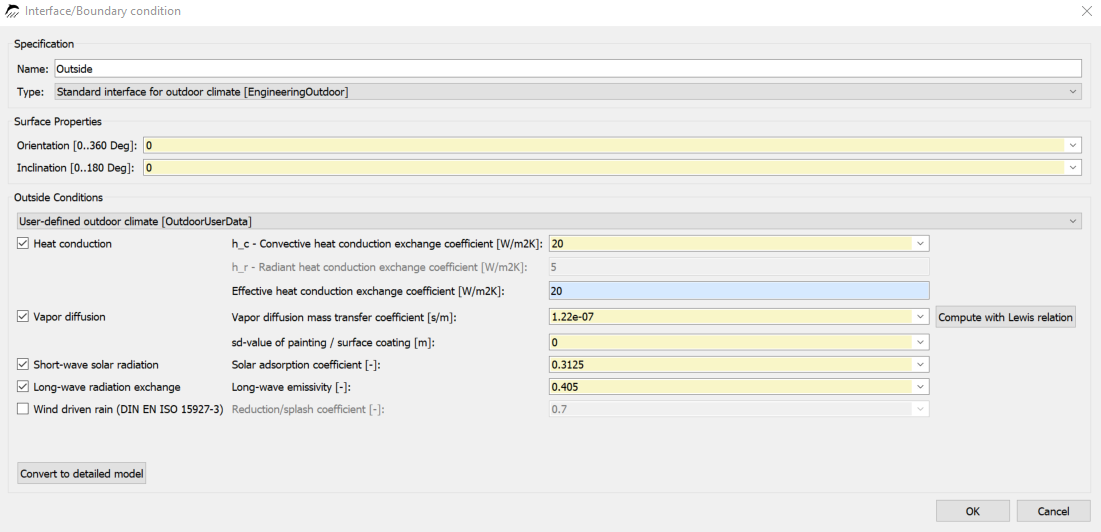
At climate data temperature and relative humidity for inside and the outside air temperature must be selected. What can be selected here depends on the climate data used. As an example the simple case of both surfaces each for outside and inside with the simple model is selected here (see following figures).
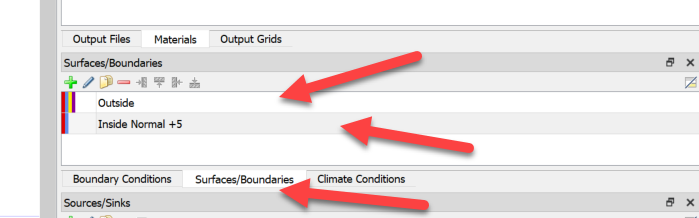
The image above shows the surface list with the currently defined surfaces. The next image shows the dialog with the settings for the exterior surface. It is the simple model selected. The climate data is obtained from the set climate location.
The next image shows the indoor climate.
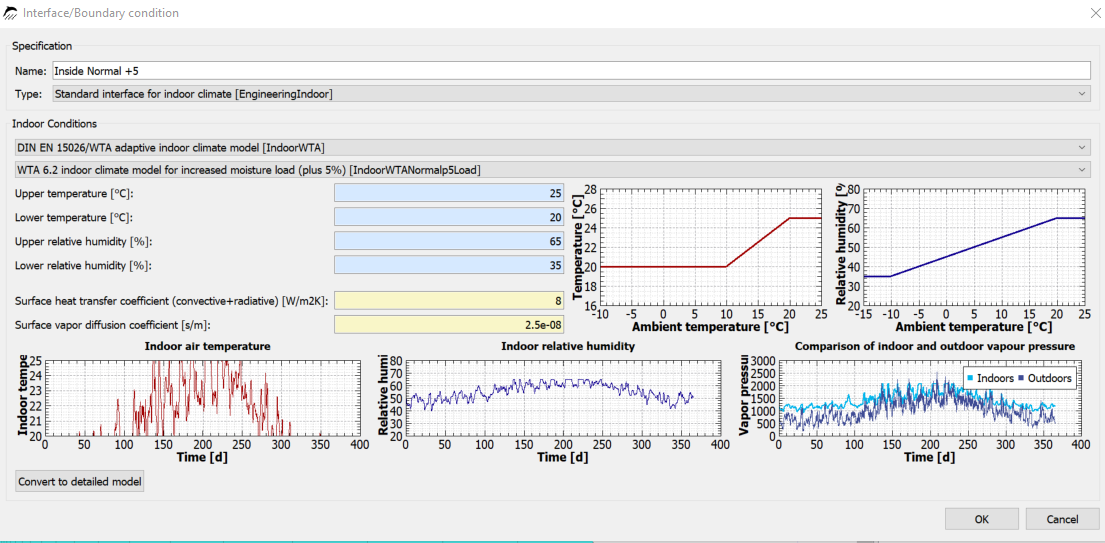
For the indoor climate, the adaptive climate according to WTA 6.2 was chosen. This means that temperature and humidity are calculated from the outdoor air temperature using the chosen model. It also means that these data are not available as external file or climate condition. Since DELPHIN version 6.1.3, however, there is the possibility to use the climate data via the name of the surface that is used. The currently selected surface for indoor is called 'IndoorNormal +5'.
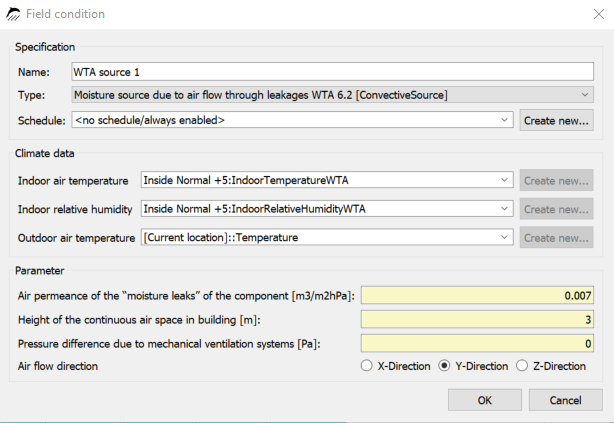
In the image above all climate data are selected. For indoor climate, the name is composed of the name of the generating surface and an internally chosen identifier that reflects the type of climate component and surface type. So for temperature, the climate is named: 'Indoor Normal +5:IndoorTemperatureWTA'. For the outdoor air temperature, we can directly select the data from the climate location. These can be recognized by the prefix '[Current location]'.
Furthermore, we have to select the parameters for the air tightness of the construction, the height of the air space, possibly an additional air pressure difference and the flow direction. In this case, the air permeability is 0.007m3/(m2ĥPa) which corresponds to a construction without a tightness test. The height of the largest contiguous air space in the building is needed for the buoyancy calculation. Here, the height of the building is usually chosen, because a column of air of this height can form over the stairwells. In the present case, the height is 3m. It is a single-story building. Since no mechanical ventilation system is installed, the additional pressure difference was set to 0. A value is only to be entered here if an existing mechanical ventilation system generates an overpressure in the room. Finally, the air flow direction must be entered to determine the width of the condensation area. For 1D constructions this is always the discretization direction. For 2D constructions you have to define the direction yourself. For example, if a roof is entered as shown in the picture below, the direction is Y.
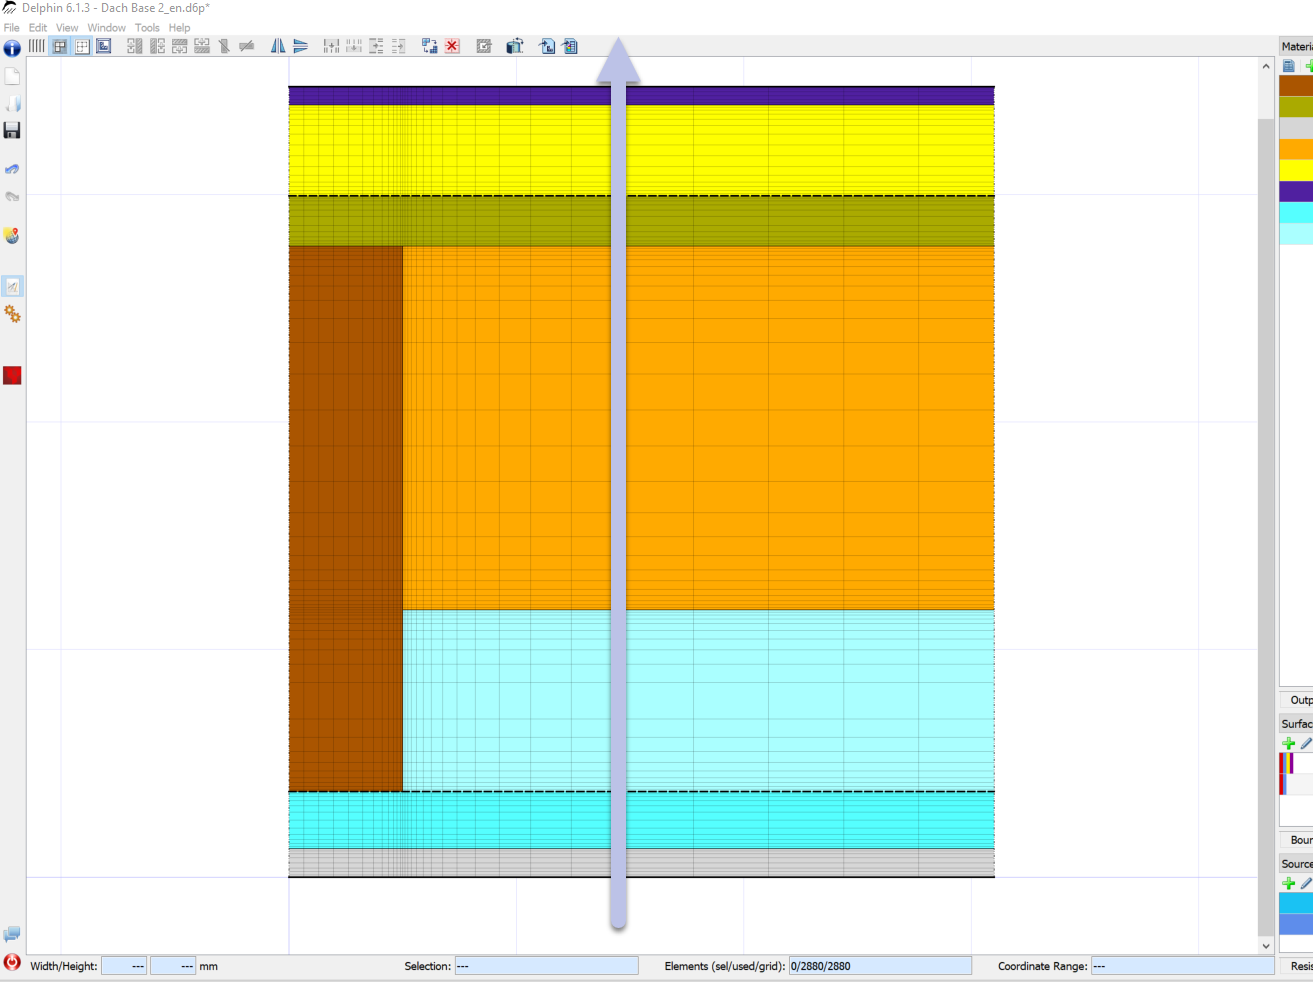
2.2. Assignment of source
After the source definition has been created, it must be assigned to the construction. As explained above, this should be done on the upper side of the mineral wool (cold side), directly under the OSB board. To do this, select a area about 1cm high and assign the source there. To facilitate the assignment, it is recommended to switch the construction display to equidistant mode beforehand. The picture below shows the assignment with the switch button for the equidistant mode marked.
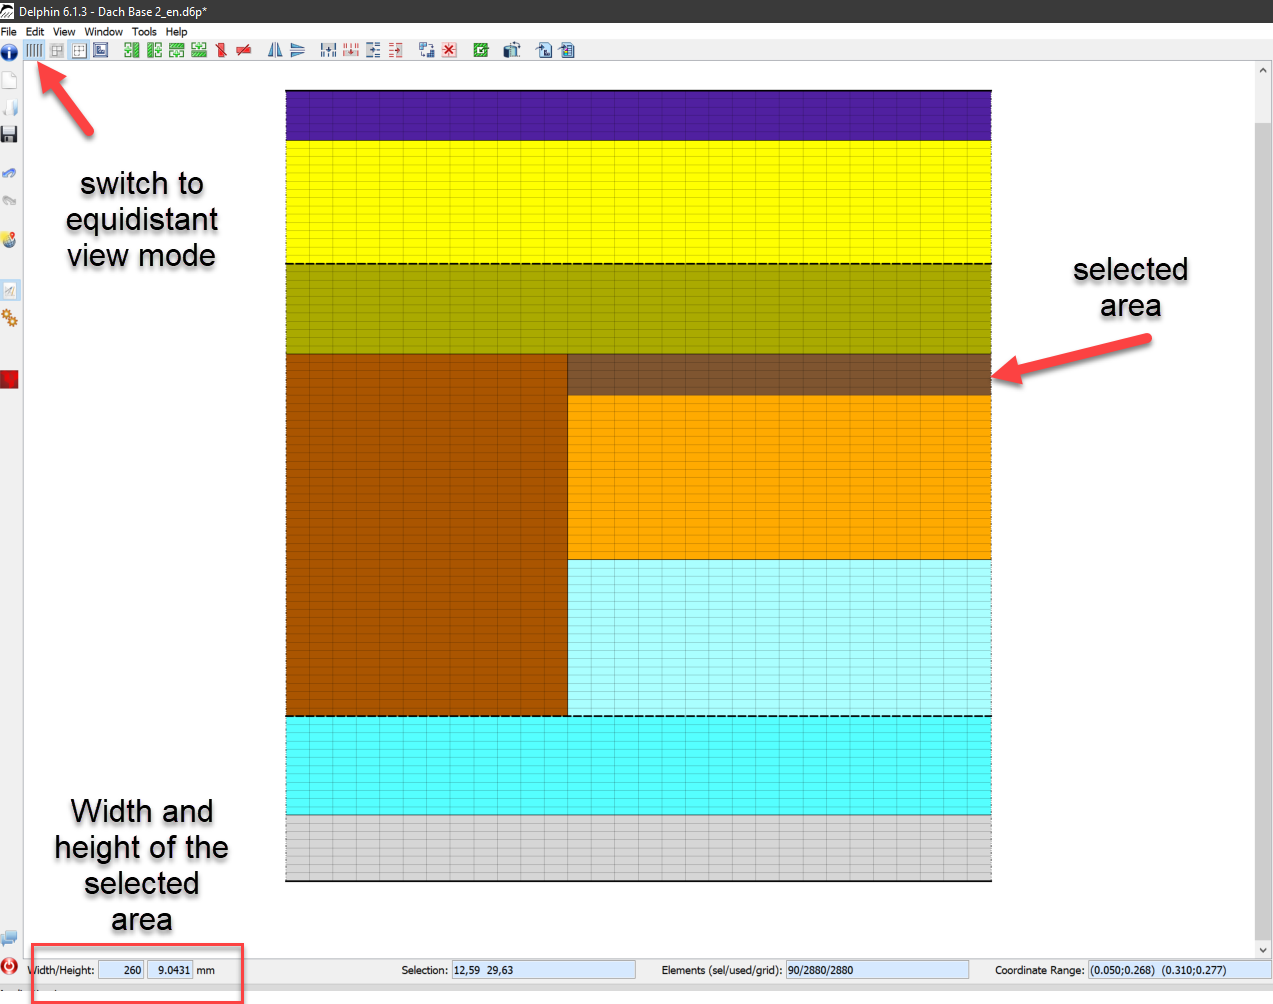
After the area is selected the source can be assigned by clicking on the green Assign button.
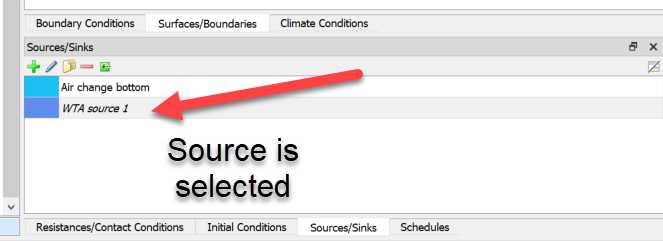
If the assignment was successful, the name of the source in the list is now displayed in normal font instead of gray and italic. A source may only be assigned once at a time. If multiple sources are required, they must also be created in the appropriate number.
2.3. Output to source [source_output]]
To control the results it is useful to output the condensation created from this source. For each source in DELPHIN certain outputs can be defined. More about this can be found here: DELPHIN Online Help Outputs.
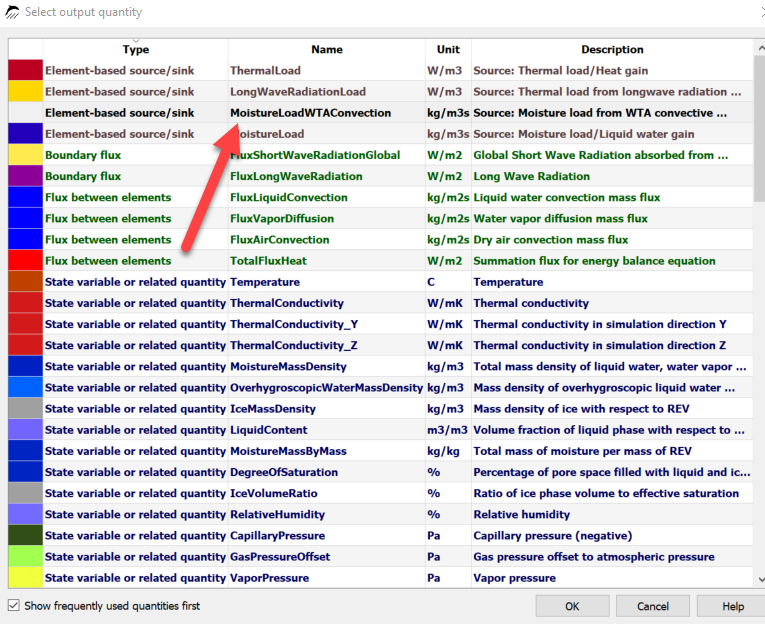
First you have to define the outputs. To do this, create a new output and select 'MoistureLoadWTAConvection' as size.
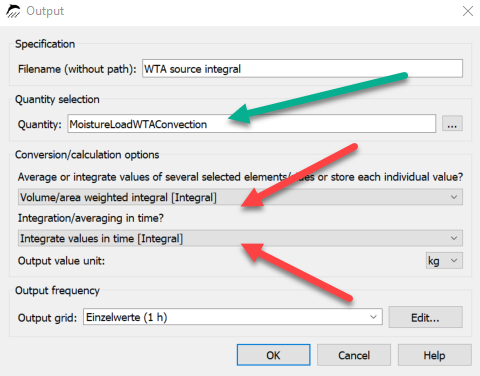
So that the output is comparable with the standard values of DIN 68800-2, one should select 'volume weighted integral' for the space and 'integrate values in time' for the time. Then the amount of moisture in kg will be output for the selected area and for the whole period. This output must be assigned to the same area as the source.
To determine the source quantity for a year, one must then only calculate the difference of the values from the end and beginning of the respective year. For this you can use well the table view of PostProc 2.