1. Overview
The CCM Editor is a software tool for creating, checking and editing climate data records in c6b format, which are then used in the IBK simulation programmes DELPHIN, THERAKLES and NANDRAD.
|
CCM is an abbreviation for Climate Calculation Module, the central library for climate data handling and calculation of climatic impacts, which is used equally by all IBK simulation programmes. |
Climate data can be available in very different forms, from measurement data to station data, individual files (e.g. 'ccd' files) and in tabular form. Equally diverse are the sources of error that result from processing and interpreting the data.
It is difficult or even impossible for simulation programmes to map all these variants completely automatically. In addition, many interpretation rules would then have to be configured by the user. This is one reason for the 'c6b' format, which follows very strict rules as the input format for building component and building energy simulation, and thus relieves the simulation programs.
|
The models usually implemented in hygrothermal component simulation programs and building energy simulations require the data stored in the 'c6b' format. Instead of implementing different model variants or conversions between climate data in the individual simulation programs, the conversion of the data is carried out as a pre-processing step. With the |
With the CCM-Editor climate location data in 3 formats (.c6b, *.epw, *.wac) can be read and edited directly. Furthermore, .ccd files (from DELPHIN 5) can be imported.
The programme allows convenient data exchange with spreadsheet programs (Excel, LibreOffice-Calc, etc.) and has a generic text format import wizard, which also performs the conversion from direct horizontal radiation to normal radiation (see also direct radiation).
The main task of the editor is the quick visual check of the climate data, as well as checking the contents so that the climate data in the c6b data format contain meaningful and valid input values for the simulation.
1.1. Climate data formats
A climate contains meteorological data records. These can be generated from measurement and/or by algorithms. For most simulation programmes, climate data such as outdoor air temperature and humidity and radiation intensities are important and are used as input parameters for calculations. This can then be used to perform simulation-based analyses, e.g. of a building model or construction details.
The physical quantities can be stored in various file formats, both in ASCII files and in binary format. The 3 most important formats are briefly described below, which can be read directly by the CCM Editor.
|
All formats described below can also be read natively by the simulation programmes DELPHIN, THERAKLES and NANDRAD. Nevertheless, it is sometimes useful to check these data first in the CCM-Editor and correct them if necessary. |
1.1.1. C6B
The climate data format C6B was developed at the Institute for Building Climatology at the TU Dresden and represents annual and continuous climate data sets. The format contains the following data:
-
Air temperature in [C]
-
Relative humidity in [%]
-
Direct Normal Radiation in [W/m2]
-
Diffuse horizontal radiation in [W/m2]
-
Wind direction in [°]
-
Wind speed in [m/s]
-
Long-wave sky counter-radiation in [W/m2]
-
Air pressure in [Pa]
-
Precipitation on a horizontal surface [l/m2h].
The data are stored in a binary format (primarily for licensing reasons). For larger (multi-year) climate data, reading the file is faster, and in addition the check of valid number formats during reading is omitted. In variation studies (Monte Carlo analyses, sensitivity studies, etc.), where many fast DELPHIN simulations are started, reading and processing the climate data sometimes takes quite some time.
|
The data of a 'c6b' file can also be read conveniently with the programme https://bauklimatik-dresden.de/postproc/index.php [PostProc 2] and exported as graphics. DELPHIN also has a climate data preview. |
The format is described in detail in the following publication:
Nicolai, A.: DELPHIN 6 Climate Data File Specification, Version 1.0, 2017, Technical Report, Qucosa, https://nbn-resolving.org/urn:nbn:de:bsz:14-qucosa-221222
|
At first glance, the binary format has the disadvantage that direct editing, e.g. in a text editor, is not possible. The CCM editor (hopefully) makes up for this disadvantage. On the other hand, when used in a simulation programme, no more errors can occur from parsing numbers in ASCII format when reading in this data. |
1.1.2. EPW
The EPW format is a simple ASCII text format. It is supported internationally by many simulation programs. There is also a https://energyplus.net/weather [Weather Data] database on the EnergyPlus website. This offers a variety of climate data from different locations worldwide. The format supports the following data:
-
Air temperature (dry and dew point)
-
Relative humidity
-
Sky irradiance
-
Solar radiation (global, direct, diffuse)
-
Light data (illuminance global, direct, diffuse)
-
Wind data (speed, direction)
-
Sky coverage
-
…
The EPW format defines one or more start and end times (1.1. - 31.12.). Furthermore, the intervals are defined e.g. hourly data or quarter-hourly data).
A comprehensive specification can be found on the EnergyPlus website at Auxiliary Programs.
1.1.3. WAC
The WAC format was introduced by the Fraunhofer Institute for Building Physics in Holzkirchen primarily for hygrothermal simulations. It can be processed natively by DELPHIN and, as an ASCII format, is suitable for easy editing in the text editor. WAC files contain in principle the same climate data as 'c6b' files. Solar radiation is given either as direct horizontal radiation or global radiation on a horizontal surface. Compared to EPW, the format is somewhat easier to generate from spreadsheet programs (Excel, LibreOffice/Calc, etc.), but otherwise equivalent.
1.2. Basic information on climate data
The climate data itself is partly stored in different ways and is either stored as instantaneous values or integral mean values. This consideration is not always apparent from the climate data format and is handled differently even in the case of data from the weather service, depending on the location.
1.2.1. Temperature
The air temperature is usually documented as an instantaneous value.
1.2.2. Solar radiation
Solar is usually represented as an integral mean value. For this purpose, the radiation energy, which was measured e.g. in one hour, is summed up (as the simplest form of integration). The German Weather Service shows the energy per area in J/cm² for the radiation data.
In the climate data set, the integral mean value is then given over a selected interval (usually one hour). This is an amount of energy that impinges on a surface (1 m²) in a certain time interval (e.g. 1 h). The unit could therefore be Wh/hm², or shortened to W/m² (the usual unit).
Solar radiation is always short-wave radiation. Solar radiation is indicated in different ways.
Global radiation on a horizontal surface
Global radiation is the sum of direct and diffuse radiation and is usually measured on a horizontal surface and therefore indicated accordingly. It is also possible to measure global radiation in the normal direction by means of solar tracking, but this is rather unusual and is rarely used in meteorological data.
direct_radiation
Direct radiation is the fraction of radiation that is only incident from the direct rays of the sun. This is usually measured horizontally.
In the climate data set, this radiation can be specified either as horizontal radiation or as normal radiation. Normal radiation_ means that the surface under consideration is always perpendicular to the respective sunbeam.
For the conversion between horizontal and normal radiation, the sun elevation angle and the sun direction angle must be known. These can be calculated for any location and any time.
The conversion from direct normal radiation to direct horizontal radiation is described in the following equation.
where h is the solar elevation angle, \( q_{rad,h} \) is the radiation intensity on the horizontal surface, and \( q_{rad,N} \) is the normal radiation.
|
The CCM-Editor comes with several import functions that perform the conversion from horizontal radiation to normal radiation. |
Diffuse radiation
The diffuse radiation in the climate dataset describes the radiation of the sky without the direct radiation part. The diffuse radiation is usually measured and indicated on the horizontal surface.
1.3. Annual data sets in the hourly grid
Most climate data are stored as an annual data set in an hourly grid, leaving out leap days. As a result, such a data set contains exactly 8760 values. It should be noted that most simulation programmes only support exactly this number of data values. However, the following properties are interpreted differently from programme to programme and should therefore always be checked in advance.
-
Time shift (e.g. UTC+1)
-
Time change (winter-summer time)
-
Leap years - these are usually not taken into account by simulation programmes. I.e. in leap years the 29th February is omitted.
-
Interpretation of time points for hourly data (beginning, middle or end of the hour).
For climate data records in 'c6b' format, the data contained therein are interpreted as follows:
-
there is no summer/winter time changeover
-
the first data value corresponds to the end of the first hour of the year for instantaneous values (i.e. 01.01. 1:00), and for integral mean values (radiation, precipitation) this is the mean value of the previous first hour of the year (i.e. from 01.01. 0:00 to 1:00)
-
there are no leap years
1.4. Data sets with flexible time stamps
A data set can also be created using flexible timestamps and data points. The period of data storage is arbitrary. It is therefore possible to define a data record from 01.06.2007 12:45 to, for example, 15.03.2020 8:00. The intervals between individual time points can be as small as desired, even less than 1 second, but in the CCM Editor time points are only displayed to the second when using time stamps.
|
When using flexible time grids, the time points must strictly increase monotonously, otherwise this will be recognised as an error and the |
Internally, in the c6b format, the time points are stored as time intervals from 0:00 on 01.01 of the start year (first year of data collection). A change of the start year parameter (see metadata/station information) therefore leads to a shift of the data in each case.
2. Programme interface
The programme interface of the CCM Editor. image::GUI02.png[width=643,pdfwidth=17.65cm]
The programme is basically divided into 4 areas:
-
Toolbar [1]
-
Properties window with station data [2]
-
Climate data preview [3]
-
Table with climate data
2.1. Toolbar
The toolbar offers the following options:
-
create new project
-
load existing climate data set
-
save current climate data set
-
copy the entire table, including column headings
-
insert data with import wizard
-
add more rows (only for datasets with flexible dates)
-
Remove selected rows (only for datasets with flexible time points)
-
Switching the display in the time column between date/time stamp and time since the beginning of the year
-
Selection of the number format (German: number format 123456,789; English: number format 123456.789)
2.2. Properties window with station data
In this area, the location data is defined. This includes the names of city and country, the code of the weather measuring station (WMO), the data source, the altitude above sea level as well as the longitude and latitude. Furthermore, an additional description can be entered.
2.3. Climate data preview
The climate data are visualised here by means of diagrams. Zooming into the diagrams is possible by dragging an area with the left mouse button. Zooming out is possible by right-clicking.
|
Climate data are only displayed if all data of a column are available and in the valid range. |
3. Creation of new climate data sets
Climate data sets can be annual data in hourly raster (usual for annual or multi-annual cyclic data). If you want to create climate data sets from measurement series, you may need other time grids or flexible time steps. Also, measurement series often start in the middle of the year.
The CCM Editor distinguishes between both time series variants when entering data. Therefore, already when creating a new climate dataset, the setting must be made whether it is an annual dataset or a flexible time grid.
|
The choice between hourly annual data and flexible time grid can only be selected when creating a new climate data set. A subsequent changeover is not possible. However, one can quite easily transfer the data from an hourly annual dataset to a flexible time grid by copying the data series to a spreadsheet, creating a new climate dataset, and copying the data back again (see copy to clipboard and back). |

When selecting annual datasets with hourly data, the table has exactly 8760 rows and the time points are fixed per row. When using flexible time points, the table initially contains only 2 rows. Additional rows can be added with ![]() , or removed with
, or removed with ![]() .
.
4. Editing climate data
In the table, the climate data are displayed in tabular form. They can be edited by double-clicking on a cell or by entering a number.
4.1. Input data check
Each value entered is checked for validity. Inputs that are not recognised as numbers are not accepted by the editor. If a numerical value is outside the accepted value range, the value is accepted but marked as incorrect in red.
4.2. Incorrect values
A value of --- indicates that no valid value exists in this cell. This corresponds to a missing value.
|
Missing values can be deliberately set by entering the number -9999. However, this should then be done for all values in a column, thus specifying that this climatic variable is not recorded/available. |
4.3. Colour highlighting of the header row
Depending on the content of a table column, the header line is coloured differently in order to clarify the status.
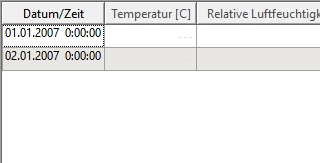
4.3.1. No data available
If no data at all are available for a climatic variable (usually precipitation or pressure), the header of the table column is coloured grey.
4.3.2. All values within the accepted value range.
If all values are entered, i.e. not a single missing value remains in the table column, and at the same time all values are within the accepted value range, the table heading is written in black as normal.
Valid data column, black heading image::SpalteAktiv.png[width=320,pdfwidth=6.4cm]
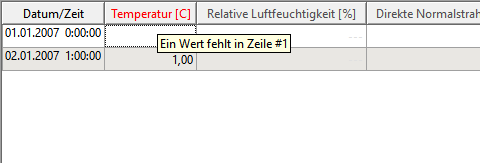
4.3.3. Data values are missing in the column
As soon as at least one value is entered in a cell, the system checks whether all other values of this data series also contain values. If values are missing, the header of the column is displayed in red and the tooltip (move the mouse over the column header) shows the cell in which the first value is missing.
|
Sometimes with larger data sets, a value may be missing somewhere in the middle, and the tooltip will show an error in row #1500, for example. Since the table itself does not display the row numbers, the easiest way to fix the problem is to copy the entire table or column into a spreadsheet (see section copy to clipboard and back). Then the named row can be found quite quickly. Alternatively, one can search for |
4.3.4. Invalid value
If a value is entered somewhere in a table column that is outside the accepted value range, the row header will also be coloured red in this case. In this case, the tooltip again shows the row in which the first incorrect value is located.
Value outside the validity range in a data series, red heading and tooltip gives information about the row with the incorrect value. image::SpalteFalschwert.png[width=480,pdfwidth=9.6cm]
4.4. Accepted value ranges
CCM-Editor checks entered data for plausibility. Valid values are in the following (partly quite generous) value ranges:
-
Temperature [-100,+100] in C
-
Relative humidity [0,100] in %
-
Radiation values [0,1500] in W/m²
-
Wind direction [0,360] in DEG
-
Wind speed [0.120] in m/s
-
Air pressure [0.200000] in Pa
-
Rainfall [0.100] in l/m2h
|
If values outside these range limits are found in table columns, they are marked red and the column heading is also coloured red (see section Invalid value). Also, the data series in question will not be displayed in the chart until all values are within the accepted value range. |
4.5. Copying data to the clipboard and back.
CCM-Editor does not claim to replace a spreadsheet. Actually, climate data should be entered/generated/converted in a spreadsheet (Excel, LibreOffice/Calc, etc.) and then simply copied into the editor.
For this purpose, the CCM Editor offers various copy operations to the clipboard, and back from the clipboard.
4.5.1. Copying the entire table to the clipboard
The button ![]() causes the entire table including the header lines to be copied to the clipboard. The numbers are copied either in German or English format according to the language setting in the toolbar.
causes the entire table including the header lines to be copied to the clipboard. The numbers are copied either in German or English format according to the language setting in the toolbar.
In the clipboard, the table is stored as tab-delimited columns, and can thus be pasted directly into programmes such as Excel or LibreOffice/Calc or similar.
|
It makes sense to adjust the language setting of the number format in the CCM Editor to the current setting in the spreadsheet or other target application. If you want to process/adapt the data in a script, for example, the English number format is a good choice for copying into a text file. |
When inserting the data into the target application with Ctrl+V, you may have to define the date column so that the spreadsheet recognises the date/time stamps correctly.
|
You can also first copy the data directly into Excel or similar software and then convert the date/time column afterwards using _Text to Columns_Conversion. |
4.5.2. Copying a selection to the clipboard
If you only want to copy part of the data, e.g. a column, select it in the table. The usual key combinations are supported:
Key combinations for selection and navigation in the table
| key combination | function |
|---|---|
cursor keys |
moves the current cell |
Ctrl + cursor keys |
moves the current cell to the beginning/end of the table area respectively |
Ctrl + Cursor keys |
moves the current cell to the left (in the same row) |
End |
moves the current cell to the far right (in the same row) |
Page Up |
moves the current cell up one page. |
Page down |
moves the current cell down one page |
If the Shift key is also held down, the selection of the cell range is enlarged accordingly.
|
Marking with the mouse is also possible. To select an area, first mark a cell, then move the mouse (scroll wheel, or moving the scroll bar) to the target cell and hold down the Shift key while clicking on the second cell. |

The selected cells are copied to the clipboard with the keyboard shortcut Ctrl+C. The column headers are not copied.
You can paste the selected table contents directly into the target application with Ctrl+V.
4.5.3. Paste from clipboard
When inserting data, a distinction is made between direct insertion and import by means of import assistant.
When inserting data directly from the clipboard using the keyboard shortcut Ctrl+V, no conversion is always performed.
|
The units of the data copied into the CCM editor must correspond to the target column(s)! |
The behaviour of the CCM-Editor thus corresponds to the usual spreadsheet programmes. When inserting several columns, make sure that the physical quantities are correctly assigned.
|
One source of error is the confusion of direct radiation data on a horizontal surface and normal radiation data. If horizontal radiation data are copied directly into the CCM Editor table, they are not converted and interpreted as normal radiation data. If the data are available as horizontal radiation data, it is mandatory to use the import wizard. |
Insertion into annual data sets
For annual data sets, the contents of the clipboard (tab-delimited columns) are read and copied into the table during insertion, as with normal spreadsheet programmes. Existing data is overwritten.
The process starts with the currently selected cell. Values outside the data range (number of columns or rows is exceeded) are ignored when pasting.
Inserting into data sets with flexible times
When inserting this data, a distinction must be made as to whether the data has a date/time column. If this exists in the data set of the clipboard, the start cell must be selected in the date/time column. If the clipboard contains more rows than exist in the current data set (or can still be inserted), these are appended below.
When inserting data without a timestamp/time, you must select an insertion cell in a data column. Any surplus rows are ignored during insertion, as with annual data sets (since there is no information about the times of the data rows to be inserted).
5. Station data/description data for the climate data set
In addition to the actual climate data, you can also specify station data. Some are optional, such as the description or the WMO code. The properties:
-
City name (location)
-
Latitude and longitude
-
time zone
and in the case of flexible time data
-
start year
must be entered.
Multilingual identifiers can be used when entering the station/city names and the country. In this case, individual identifiers are entered separated by | and each defined with a language abbreviation, e.g.:
de:<german text> | en:<english text> | it:<italian text>
The usual internationalised language IDs are used as language abbreviations.
6. Climate data import
Climate data are available in different formats. The easiest way is usually to enter the data in a spreadsheet. From here, the data can easily be imported into the editor using the import-assistant.
Likewise, the data can be transferred from any text files into the editor.
For directories with ccd files (from DELPHIN 5) there is a special import wizard.
6.1. DELPHIN 5 CCD file import
In the DELPHIN 5 simulation programme, individual climate data were kept independently in their own files. Each time series could even use its own time grid. A climate data set consisted of many 'ccd' files in a directory, whereby the assignment of a file to a climate variable was done via file names and keywords stored in the header of the file. In DELPHIN 5, direct radiation was used as horizontal radiation. When transferring the data into the 'c6b' format (e.g. for DELPHIN 6), the radiation has to be converted into a normal radiation. The s is done automatically when importing a CCD climate data directory.
Such a climate data directory can be imported with CCM-Editor by calling the menu command File → Import CCD directory…. In the import dialogue that appears, one must still specify the longitude, latitude and time zone.
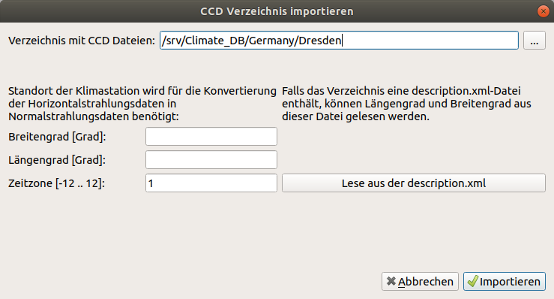
You can also read this data from a description file located in the directory. Such a file has the following format:
<?xml version="1.0" encoding="UTF-8"?>
<ClimateDataLocation>
    <Position latitude="51.1328" longitude="13.7719" altitude="221"/>
    <TimeZone>1</TimeZone>
    <Description langid="en">Dresden (Airport), Germany</Description>
    <Description langid="de">Dresden (Airport), Germany</Description>
</ClimateDataLocation>
Longitude and latitude are expressed in degrees. Altitude above MSL is given in metres. The description is separated into city and country identifiers at the first comma.
During import, the horizontal radiation data are converted to normal radiation data using the position of the sun at the given time.
6.2. Importing individual CCD files
Using the menu command 'Data → Import CCD file…', individual CCD files can also be imported. Depending on the keyword and unit in the file, the imported data is automatically entered in the corresponding line.
6.3. Importing climate data using the import wizard
The Import Wizard is primarily used to convert solar radiation data during import, as this requires a sun position model. However, more specific conversions should be done in advance in a spreadsheet.
The import wizard is always called by executing the action ![]() in toolbar.
in toolbar.
When the import assistant is started, the contents of the clipboard are first displayed in the dialogue. If, on the other hand, you want to paste the contents of a file, simply open it in a text editor, select everything (Ctrl + A) and copy everything to the clipboard (Ctrl + C). Then you can open the import wizard.
The import process is divided into two parts:
-
determine the structure of the source data (rows and column range, as well as column separators)
-
assigning the data series to the climate data
6.3.1. Defining the data structure and column separators
On the first page of the wizard, you specify which range is to be imported.
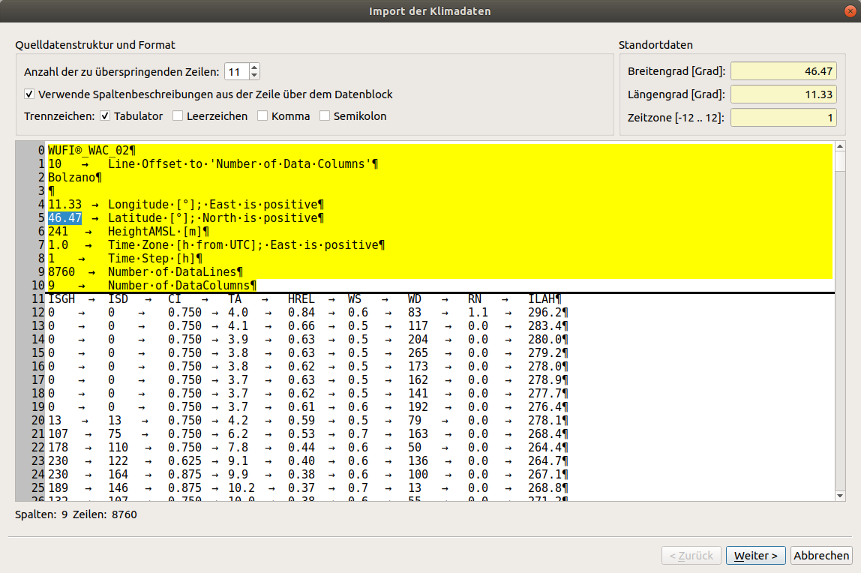
Various settings are set on the wizard page:
Number of lines to skip.
If a file has a header before the actual data, this allows you to skip it. In the screenshot above, the first 11 lines of the file are skipped.
Use column descriptions from the row above the data block.
If the data area, i.e. columns with the climate data, has a row above it with column labels, you can select this checkbox. The next wizard page will then show the column headings above the individual data columns.
In the screenshot such a header can be seen as part of the data range to be imported.
Separator
The characters recognised as separators are selected here.
Location data
Longitude, latitude and time zone must be entered here. These are needed for the conversion of the solar radiation data.
Often these can be copied from the header of the data.
In screenshot the location data have already been copied from the header.
6.3.2. Column configuration
On the 2nd page of the wizard you define the column properties.
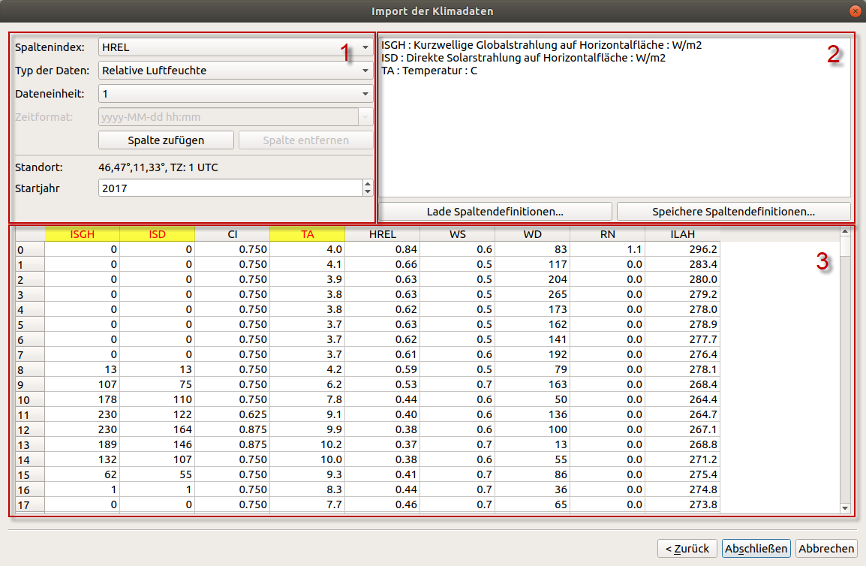
The wizard page contains:
-
Configuration options for new column definitions [1].
-
List of already configured columns [2] (and buttons to save/load such configurations)
-
The data columns already read [3].
The data columns are highlighted in colour:
-
yellow background - column is configured for import
-
red text in the data field - incorrect value/invalid number format
For each column to be imported (any selection is possible), perform the following steps. 1:
-
select the column to be imported; if the use of a header was enabled in the previous wizard step, the column headers are displayed here, otherwise the column number.
-
selection of the climate data type (target column in 'c6b' format)
-
unit of the source data; in screenshot it is shown how the column
HRELis configured as Relative Humidity, and the raw data are available as values between [0..1] (unitless, i.e. unit1). -
add column (to the list of configured columns)
In the screenshot you can see how 3 columns are already configured. The column headings are also coloured accordingly.
|
If files with the same structure are to be imported frequently, it is a good idea to save the column configuration in a file by selecting the button Save column definitions… and to load it again during the next import. |
6.3.3. Completing the import wizard
Once all columns have been configured, the wizard can be completed and the actual import and data conversion will be carried out.